 Everything looks perfectly healthy on your network monitoring dashboard. Routers and switches are responding, firewalls are online, and bandwidth utilisation is comfortably within acceptable limits. Yet behind all those reassuring green indicators, something is going wrong.
Applications are slowing down, connections are dropping intermittently, and the help desk is flooded with complaints. But according to your monitoring tools, everything is working as expected.
So what's really happening across your network—and more importantly, what aren't your monitoring tools telling you?
For network engineers, this is an all-too-familiar frustration. The infrastructure appears healthy, but users are experiencing real performance problems. The uncomfortable reality is that a network can look perfectly healthy while serious issues remain hidden from view. A device can be fully operational without the applications and services running through it performing as expected.
Today's complex, multi-vendor networks span data centres, cloud platforms, branch offices, and remote users. Monitoring these environments frequently involves separate systems for network devices, bandwidth analysis, firewalls, configuration changes, and application performance. Each tool provides valuable information, but often only part of the picture. The challenge is understanding how those pieces fit together when something goes wrong.
These hidden monitoring blind spots can allow intermittent congestion, packet loss, configuration changes, and application performance problems to go unnoticed—sometimes until they escalate into major incidents.
In this article, we'll uncover what traditional network monitoring tools might be missing, explore how modern technologies such as streaming telemetry, unified monitoring, and intelligent event correlation help close these visibility gaps, and share practical insights into identifying and troubleshooting network problems that might otherwise remain hidden between dashboards.
Key Topics Covered
- When a healthy device still means an unhappy user
- SNMP Polling and the Five-Minute Visibility Gap
- Beyond Polling: Flow Analysis and Streaming Telemetry
- Too Many Tools, Too Little Context
- AIOps: From Fixed Thresholds to Meaningful Anomalies
- A practical workflow for tracing intermittent application slowness
- Where unified monitoring platforms fit into the picture
- Summary
Download now to uncover hidden issues with unified monitoring and AI-powered insights.
Related Articles
- Optimizing Cisco Router Performance: Best Practices for Effective Monitoring & Network Management
- Elevate Your Network Management with Network Configuration Manager
- AIOps for Modern IT Operations: Automating Monitoring, Reducing Noise, and Preventing Outages
- Maximizing Network Security: OpManager Firewall Analyzer Add-on
When a Healthy Device Still Means an Unhappy User
Traditional tools such as ICMP, SNMP and Syslog remain essential. They tell us whether equipment is reachable, how much CPU or memory it is using, and whether interfaces are up or down. But availability is only one dimension of network health.
Imagine a Cisco distribution switch with normal CPU, healthy uplinks and no hardware alarms. Users on one VLAN nevertheless report that their cloud-based application freezes several times an hour. A brief forwarding-path issue, a QoS queue filling, or a policy change might explain the symptoms without ever taking the switch offline.
The question that changes the investigation
Instead of asking only “Is the device up?”, ask “What happened along the user’s service path when performance degraded?” That path may cross a wireless access point, access switch, firewall, WAN link, DNS service and application server. Each dependency offers a different clue.
Our Cisco router monitoring guide explores the device-level measurements that form a useful starting point. Here, the focus is on the information that can fall between those measurements.
SNMP Polling and the Five-Minute Visibility Gap
SNMP monitoring commonly collects interface counters at scheduled intervals. Suppose a 10 Gbps uplink is polled every five minutes, but a burst saturates it for only 30 seconds. If the link is otherwise idle, the average over that five-minute window is just 10% utilisation.
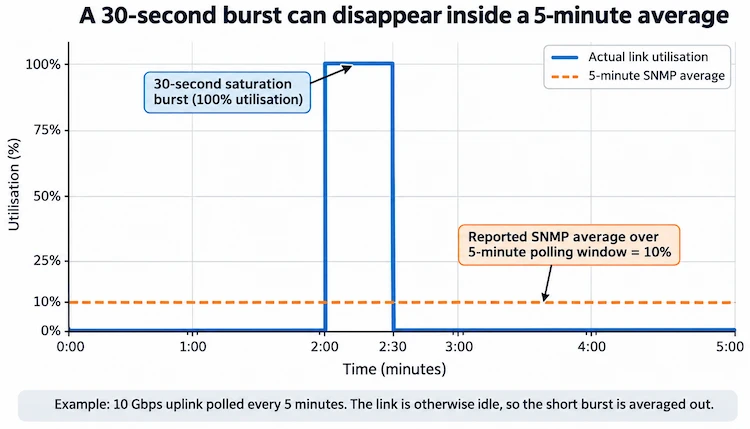
The graph may appear reassuring, even though applications experienced severe congestion during those 30 seconds. Averages describe the collection window; they do not reveal every peak within it.
This does not make SNMP inadequate or obsolete. Polling intervals are configurable, and interface error and discard counters can expose problems that average utilisation misses. The key is knowing which measurements are averages, which are counters, and which events require finer time resolution.
What to check beyond an average utilisation graph
- Interface errors and discards, not simply interface status.
- Queue drops, latency and jitter where the equipment exposes them.
- Shorter sampling windows around the reported incident.
- Application response times at the same timestamps.
Beyond Polling: Flow Analysis and Streaming Telemetry
Different sources answer different questions. SNMP can show that an uplink is busy; NetFlow, sFlow or IPFIX can help reveal which conversations are generating the traffic. Configuration logs may explain why a path changed. Application metrics can show whether users were affected at precisely the same time.
Streaming telemetry adds another option. With supported gNMI and OpenConfig subscriptions, network devices can provide structured measurements at configured intervals or when values change. This can make short-lived conditions easier to investigate, provided the device, software and telemetry paths support the required data.
Not every device offers the same level of telemetry, and high-frequency data must be collected and retained sensibly. Most enterprises will continue to use a combination of SNMP, flow exports, logs and streaming telemetry rather than replacing one with another.
Practical tip: Decide what you need to detect before increasing the collection rate. Thirty-second traffic bursts call for finer measurements than long-term capacity planning. Also check whether the monitoring system stores the original samples or only longer-term averages; otherwise, the evidence may be lost before anyone investigates.
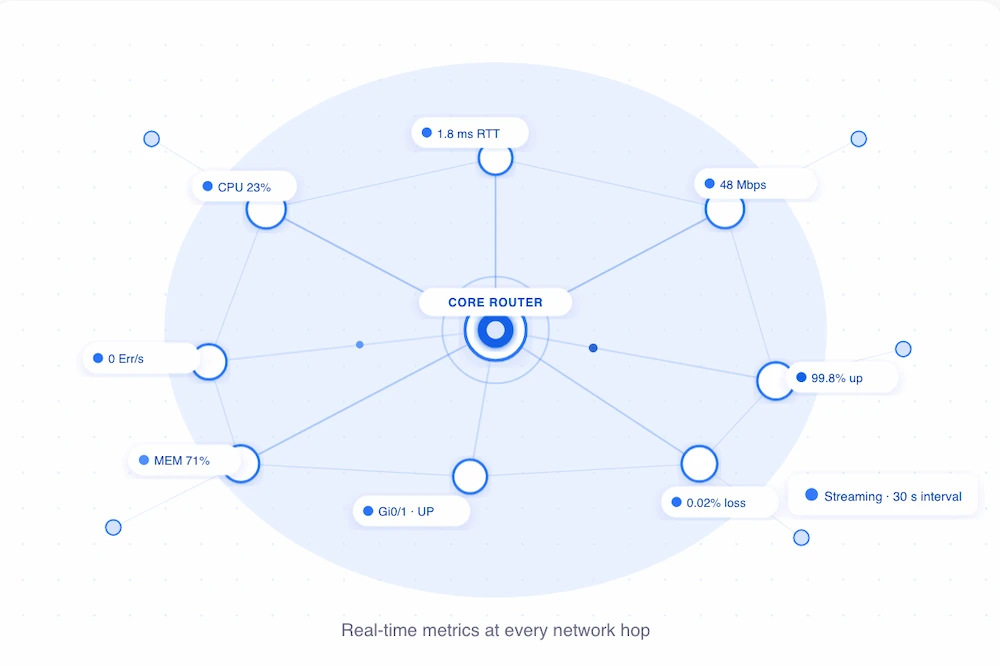
More granular network metrics can provide context that longer polling intervals may miss.
Too Many Tools, Too Little Context
A typical operations team may open four consoles to investigate a slow application: network monitoring for interface statistics, flow analysis for bandwidth consumers, configuration management for recent changes, and application monitoring for response times.
Each finding is useful in isolation. The real value appears when engineers line up the timestamps. An application slowdown, a burst of backup traffic and a firewall rule change may coincide—but that does not automatically prove one caused the others. Correlation gives investigators a hypothesis to test, not a verdict.
A small operational detail makes a big difference here: consistent time synchronisation. If devices, collectors and application servers use different clocks or time zones, events that happened together can appear minutes apart. Reliable NTP configuration and an agreed incident timeline make correlation more trustworthy.
Configuration and security evidence matter too
An unexpected ACL change, routing update, DNS failure or address conflict can break a service while the network devices remain available. Version comparisons and audit trails provide essential evidence. We examine this in greater depth in our Network Configuration Manager article.
The same principle applies to security. Unauthorised cloud services or unusual outbound destinations might be visible in flows and firewall logs but invisible on a device-availability dashboard. For more detail on policy and log analysis, see our Firewall Analyzer feature article.
Alert Storms: When More Monitoring Creates More Noise
Consider a failed upstream gateway serving several remote sites. One platform raises an unreachable-device alarm; another reports lost traffic; application monitoring signals transaction failures; and server checks begin timing out. Within minutes, dozens of alerts arrive for what may be one underlying incident.
Most of those alerts are not false. They describe real consequences. The difficulty is separating the primary failure from its downstream symptoms before an already-busy team starts investigating each notification independently.
Dependency maps and event correlation can group related symptoms and highlight a probable starting point. Engineers still need to confirm the failure, but the investigation becomes less like sorting through an overflowing inbox.
A useful first check is to identify the infrastructure component common to the affected devices and services. If several unrelated applications fail across the same WAN path, investigate their shared dependencies before treating each application alarm as a separate incident. This dependency-first approach often saves more time than raising or suppressing alert thresholds.
AIOps: From Fixed Thresholds to Meaningful Anomalies
Static thresholds are straightforward: alert when CPU utilisation exceeds 80%, or when latency passes a specified value. Their weakness is context. An 85% CPU spike during a scheduled backup may be normal, while a sudden jump from 20% to 65% during a quiet period could be unusual.
AIOps-based anomaly detection can compare measurements with historical behaviour and flag deviations from an expected baseline. Combined with event correlation, this may help teams prioritise the signals that deserve investigation rather than treating every threshold breach equally.
An anomaly is not proof of an outage or attack. Models can be affected by seasonal patterns, incomplete data and environmental changes. The right response is to validate the signal against other evidence. Readers interested in the wider technology can explore our AIOps for Modern IT Operations guide.
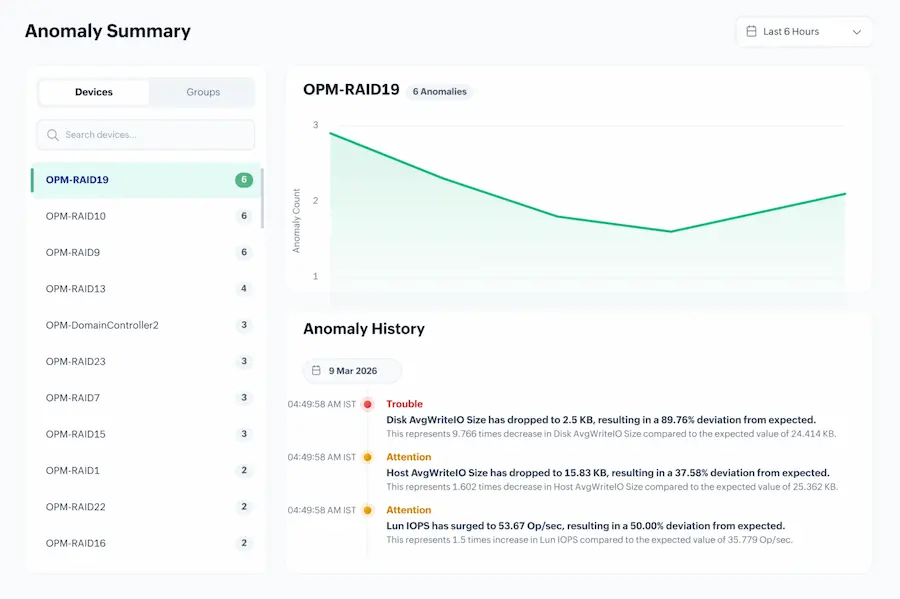
Anomaly trends and event history can help engineers compare unexpected changes with normal behaviour. Screenshot supplied with the original article.
Practical Investigation: Why Is the Application Slow?
Let’s connect the ideas using an example. Users in a branch office report that a finance application becomes unresponsive for a minute or two each afternoon. Standard monitoring shows the WAN router is online and average utilisation is below 50%.
Build a timeline before changing anything
1. Record exactly when users experienced the problem and which offices or applications were affected. Avoid starting with a broad assumption that “the network is slow”.
2. Check interface errors, discards, queue statistics and shorter-interval telemetry for bursts that the five-minute average might hide.
3. Compare NetFlow or equivalent flow records to identify traffic sources and applications active during those bursts.
4. Review recent configuration and firewall changes; then compare the evidence with application response times and server metrics.
Suppose the timestamps reveal that an automated cloud backup overlaps with the slowdown and that the affected WAN interface shows queue discards. Those observations support a congestion hypothesis. Engineers can then validate it by examining QoS policies, the traffic path and whether rescheduling the backup eliminates the symptom.
The insight is straightforward: solve the incident using a timeline of related evidence, not a single green or red status indicator.
Where Unified Monitoring Platforms Fit
The practical response to fragmented visibility is not always to replace existing tools. It may be to give engineers a more connected view of the data they already collect. Unified platforms attempt to bring device monitoring, flow analysis, configuration history, application performance and alert correlation into the same operational workflow.
One example is ManageEngine OpManager Nexus, formerly OpManager Plus. It combines several infrastructure-monitoring disciplines and supports technologies including SNMP, flow analytics and gNMI/OpenConfig streaming telemetry. Its AIOps capabilities also include anomaly detection and event correlation. The relevant feature set still depends on licensing, deployment choices and device support.
Whether using a unified platform or integrated specialist tools, the test is the same: can an engineer trace a user-visible problem from symptom to probable cause without losing essential context?
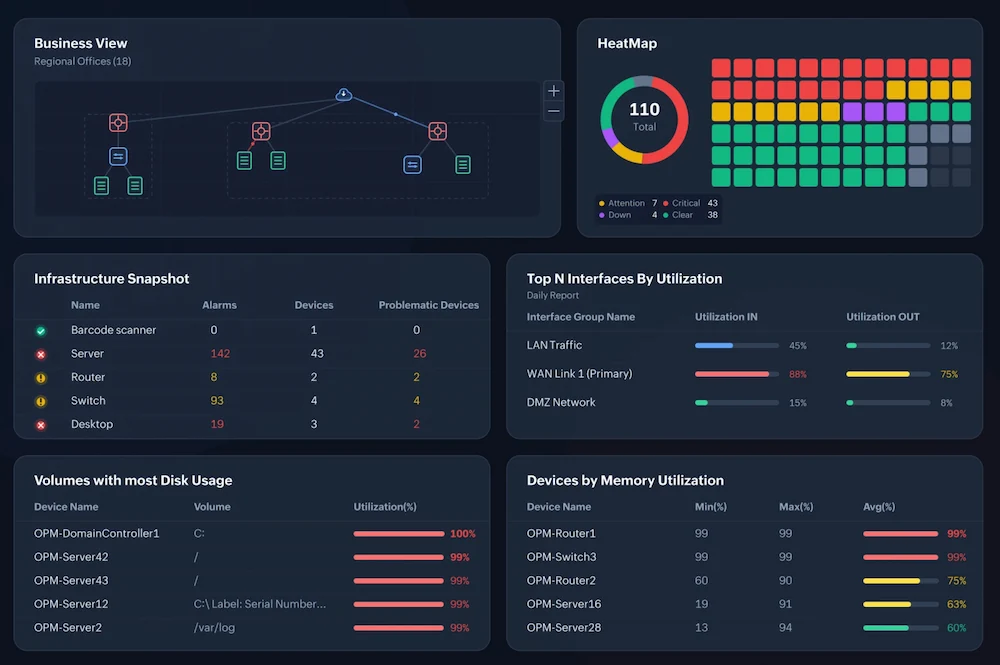
Consolidated infrastructure views can place device health, alarms and interface utilisation side by side.
Summary
Monitoring is only as useful as the decisions it supports. Healthy interfaces and responsive routers do not guarantee healthy applications, just as a flood of alerts does not guarantee a faster diagnosis.
Better visibility comes from combining the right measurements, examining short-lived changes, preserving configuration and security context, and recognising dependencies between infrastructure and services. Streaming telemetry, flow analysis and AIOps can help—but careful investigation remains essential.
The goal is not the greenest dashboard. It is knowing where to look when users tell you something is wrong. Download OpManager Nexus Now!
Can Your EDR Spot the Attack?

Enterprise-Class Cloud & Network Monitoring

Threat Traffic Analysis

Wi-Fi Key Generator
IT Infrastructure Monitoring

Follow Firewall.cx
Recommended Downloads
Cisco Password Crack
Decrypt Cisco Type-7 Passwords on the fly!
Automated Patching Solution

Firewall Analyzer