AIOps for Modern IT Operations: Automating Monitoring, Reducing Noise, and Preventing Outages
 The days of relying solely on static monitoring dashboards and manual firefighting are long gone. Today’s environments demand automation-first operations, real-time observability across every layer, and AI-driven intelligence that can make sense of the massive volume of telemetry and logs modern systems generate.
With organizations accelerating their move to cloud-native architectures, virtualization, edge computing, and hybrid infrastructures, IT operations teams now manage ecosystems that are more distributed, interconnected, and unpredictable than ever before. Traditional tools simply can’t keep up with the scale or speed.
This is exactly where AIOps is redefining the game. By combining machine learning, advanced analytics, and automated remediation, AIOps empowers IT teams to detect anomalies earlier, correlate events across domains, and resolve issues proactively—long before users feel the impact. For technical teams, it’s not just an upgrade; it’s a fundamental shift in how operations are executed, optimized, and scaled.
Key Topics
- The Evolution of IT Operations – From Reactive Monitoring to Intelligent Automation
- How Does AIOps make it all easier?
- How Modern IT Challenges Push Teams toward Unified Monitoring
- Alert Noise
- Limited Visibility Across Tools
- Slow MTTR (Mean Time to Resolve)
- Fast-paced, Constantly Changing Environments
- Where OpManager Plus Fits in this AIOps Era
- The Benefits of a Unified, AIOps-Powered Platform
- End-to-end Visibility
- Reduced Noise
- Faster Incident Resolution
- Operational Efficiency
- Future Readiness
- Summary
Download your copy of OpManager Plus Now
The Evolution of IT Operations - From Reactive Monitoring to Intelligent Automation
In the early days of IT, operations were largely reactive. IT teams would wait for a system to fail—whether it was a server crash, network outage, or application hiccup—and scramble to fix the issue. As technology advanced, the industry shifted towards more proactive approaches. Monitoring tools emerged to detect problems before they escalated, but as IT environments grew in complexity, so did the landscape of tools. Each tool specialized in a different layer: one focused on the network, another on servers, and yet another on applications. This specialization, while useful, led to tool sprawl—multiple disparate solutions with siloed data, leaving IT teams with fragmented insights. Worse, there was no unified system to correlate these insights, resulting in a disjointed view of the infrastructure.
The result? Longer Mean Time to Resolution (MTTR) as teams struggled to connect the dots between alerts and incidents.
Then came the turning point: automation and analytics. Automation allowed teams to offload routine tasks, while analytics gave them the depth of insight needed to understand the performance of their networks and systems. But with the surge in logs, metrics, and alerts, it became clear that even the most advanced human teams couldn't keep up with the sheer volume of data. This is where AIOps came into play—leveraging AI and machine learning to not just manage but intelligently interpret vast amounts of data in real-time, providing actionable insights and automating incident response.
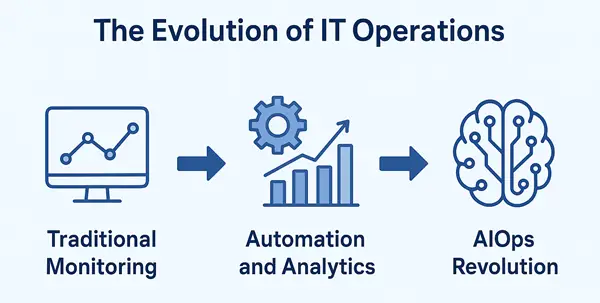
Here’s a quick breakdown of how IT operations evolved from traditional monitoring to the AIOps era:
Traditional Monitoring
Traditional monitoring was mostly reactive. Tools notified teams only after something went wrong—like a server hitting 100% CPU or an application crashing. For example, if a storage array slowed down, admins wouldn’t know until users started complaining about slow application performance. Visibility came after the impact, not before it.
Automation and Analytics
The next phase introduced automation and basic analytics. Monitoring tools started spotting patterns, triggering automated alerts, and helping IT teams troubleshoot faster with data-driven insights. For instance, an automation policy could restart a stuck service when memory usage crossed a threshold, reducing Monitoring tools downtime without manual intervention. But even with automation, the growing volume of logs and alerts became difficult for humans to manage.
AIOps Evolution
AIOps takes things several steps further by using machine learning to understand normal behavior, detect anomalies early, and correlate events across systems. This lets teams predict issues before they turn into outages. For example, AIOps might notice a slow trend in database response time, link it with rising disk latency, and alert the team before the application becomes unavailable. It moves IT operations from reactive to proactive—and eventually toward automated, self-healing environments.
How Does AIOps Make it all Easier?
AIOps automatically correlates data across domains, identifies anomalies, reduces alert noise, and predicts potential failures before they impact users. With AIOps, IT teams move from reactive firefighting to proactive prevention and ultimately toward autonomous operations.
AIOps makes IT operations easier by doing what traditional tools and humans can’t do fast enough: processing massive amounts of data, finding patterns, and connecting the dots across every part of the infrastructure. It automatically pulls in logs, metrics, events, traces, and performance data from different domains, and then applies machine learning to make sense of it.
Instead of dealing with thousands of alerts or manually searching through logs, AIOps reduces noise, highlights what actually matters, and predicts issues before users notice anything. It identifies anomalies—like unusual spikes, slowdowns, or behavior changes—based on what “normal” looks like for your environment, not on fixed thresholds that often fail in dynamic systems.
For example, if network latency starts rising across a specific segment, AIOps can link that event with a switch showing early signs of packet drops and automatically alert the team with a probable root cause. This prevents last-minute scrambling and cuts down troubleshooting time dramatically.
With AIOps in place, IT teams spend less time firefighting and more time improving performance, strengthening reliability, and planning for growth. It shifts operations from reactive to proactive—and eventually to automated, self-correcting systems.
How Modern IT Challenges Push Teams Toward Unified Monitoring
Today's IT teams face a set of challenges that traditional monitoring tools can’t handle well:
Alert Noise
Modern infrastructures generate thousands of alerts every day. Many are duplicates, low-priority, or false positives. When signal and noise look the same, critical issues get buried.
Example: A single network switch failure can trigger hundreds of downstream alerts, overwhelming admins instead of guiding them to the root cause.
Limited Visibility Across Tools
Most IT teams use separate tools for networks, servers, applications, databases, cloud services, and more. Each tool shows only part of the picture.
Example: The server team might see CPU spikes, but the network team may not realize a routing issue is causing delays—and the application team has no context for either problem.
Slow MTTR (Mean Time to Resolve)
Fragmented insights mean more time spent jumping between tools, manually correlating metrics, and guessing the root cause.
Example: A simple application slowdown could take hours to diagnose because logs, network data, and server performance metrics live in different systems.
Fast-paced, Constantly Changing Environments
Cloud, containers, VMs, microservices, and hybrid networks introduce new dependencies every day. Traditional monitoring can’t adapt quickly enough.
Example: A new cloud instance might spin up without proper monitoring, leaving blind spots that create security and performance risks.
These challenges make it clear: point solutions and siloed monitoring won't cut it anymore. Organizations need a unified, intelligent monitoring platform that can learn from the environment, correlate cross-domain insights, and automate responses—exactly what modern AIOps platforms deliver.
Where OpManager Plus fits in this AIOps Era
This is where ManageEngine OpManager Plus stands out as a modern, unified solution built for today’s complex IT environments.
Most organizations struggle with tool sprawl, alert overload, and a lack of end-to-end visibility. OpManager Plus closes this gap by bringing network, server, application, storage, virtualization, and cloud monitoring into one unified console. Instead of switching between six different tools, IT teams can finally see and manage everything in a single place.
What makes OpManager Plus align with the AIOps movement is its built-in intelligence. Features like AI-based anomaly detection, alert correlation, adaptive thresholds, automation workflows, and forecasting help IT teams detect issues early, reduce manual effort, and improve reliability.
With OpManager Plus, monitoring isn't just about collecting data—it’s about turning that data into actionable insights and automating the steps needed to keep systems running smoothly. The platform helps engineers spot root causes faster, automate routine fixes, and focus on strengthening performance rather than chasing alerts.
The Benefits of a Unified, AIOps-Powered Platform
A unified monitoring platform powered by AIOps does more than just collect data—it connects the dots across your entire environment and turns raw signals into meaningful insights. OpManager Plus brings these capabilities together in one place, helping IT teams work faster, reduce manual effort, and operate with more confidence.
Below are the major benefits, rewritten with better clarity and practical examples:
End-to-end Visibility
OpManager Plus provides full-stack visibility across networks, servers, VMs, storage, applications, and cloud components—all in one console. Instead of viewing each system separately, the platform maps the relationships between different layers so you can understand how an issue in one area impacts the rest of the infrastructure.
For example, if users report slow application performance, you can quickly see whether the root cause is network congestion, a failing disk on the server, a misconfigured VM, or a storage bottleneck. Tools like topology maps, dependency graphs, and 3D rack views help teams pinpoint the exact source of a problem without guesswork.
This connected view reduces troubleshooting time and helps IT teams fix issues before they affect users.
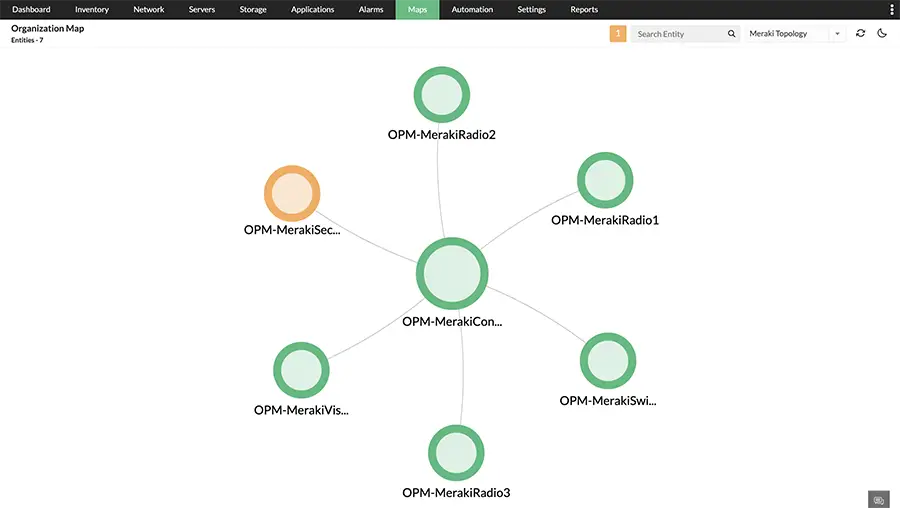
OpManager Plus - Organization Map
Reduced Noise
Alert fatigue is one of the biggest challenges in modern IT. OpManager Plus uses machine learning to filter out duplicate alerts, suppress noise, and highlight only the alerts that require action. Adaptive thresholds automatically adjust to changing workloads so the system knows when a metric is truly abnormal.
For example, if CPU usage normally spikes during backups, the system won’t trigger unnecessary alerts. But if the same spike happens at an unusual time, or persists longer than expected, OpManager Plus will flag it as an anomaly and correlate it with other data to narrow down the cause.
This helps IT teams stay focused on real problems instead of drowning in irrelevant notifications.
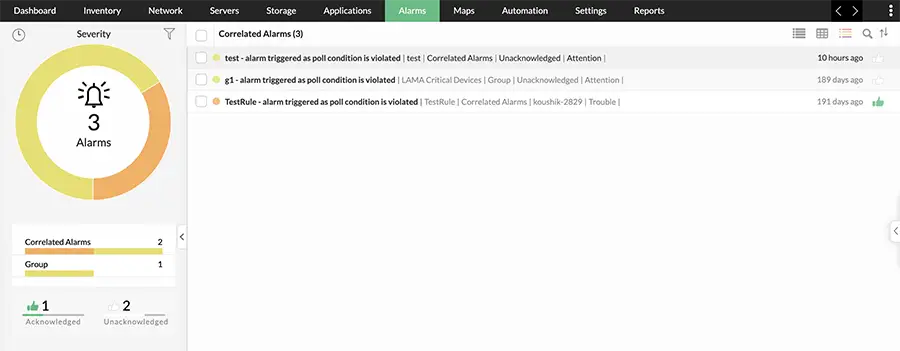
OpManager Plus - Correlated Alerts
Faster Incident Resolution
OpManager Plus significantly reduces Mean Time to Resolve (MTTR) by combining correlated insights with automation. The platform identifies the root cause using cross-domain data—network metrics, logs, application performance indicators, and system dependencies.
For instance, if a router interface goes down, OpManager Plus won’t just show that the interface is unreachable. It will also correlate the event with downstream device failures, highlight affected services, and offer probable root causes. Automation policies can then take over to perform predefined remediation actions, such as restarting a service or shutting down an overheated device.
Closed-loop automation ensures issues are fixed as soon as they’re detected, without waiting for manual intervention, resulting in faster recovery and fewer user-impacting incidents.
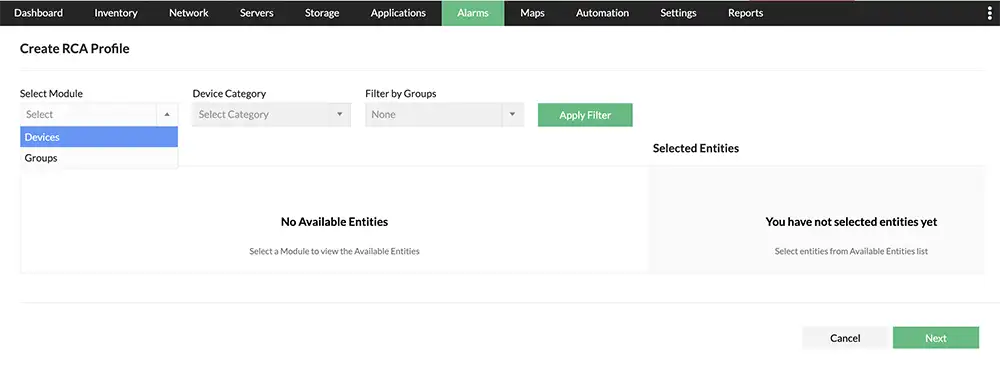
OpManager Plus - RCA Profiles
Operational Efficiency
Instead of using many separate tools for network monitoring, server monitoring, application monitoring, and log analysis, OpManager Plus consolidates everything into one platform. This reduces tool sprawl, simplifies workflows, and cuts the overhead of managing multiple vendors and licenses.
Automation and intelligent alerts further reduce the workload by handling repetitive tasks—like restarting services, running diagnostics, or generating reports.
As a result, IT teams can spend more time working on strategic improvements such as capacity planning, security hardening, and performance tuning, rather than performing constant manual checks.
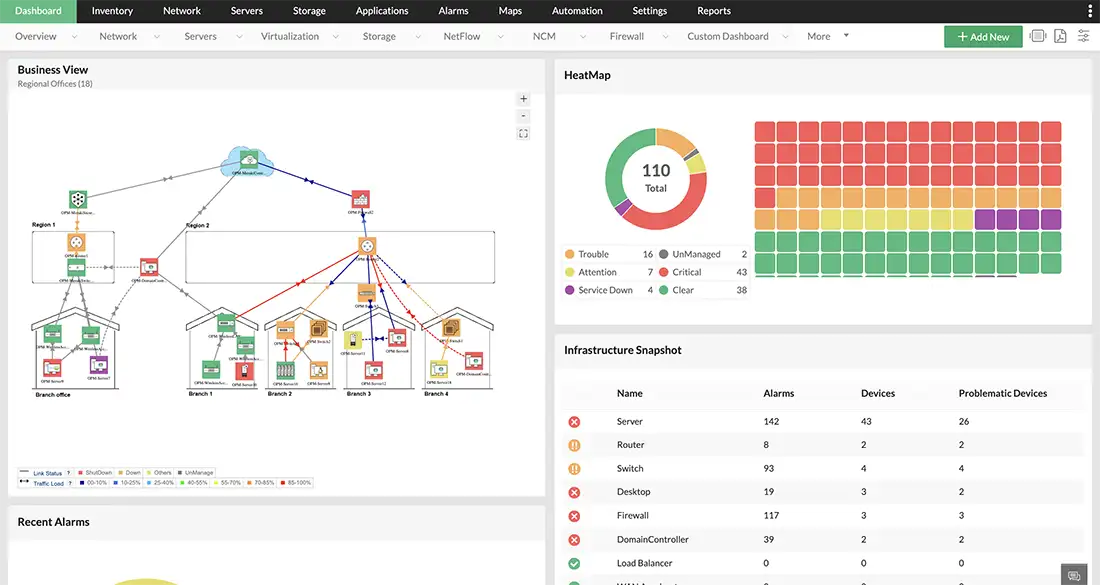 OpManager Plus - Business View Dashboard
Future Readiness
OpManager Plus is designed for modern, dynamic environments. It scales easily across hybrid cloud setups, multi-site networks, virtualized systems, and containerized workloads. The platform’s forecasting features help IT teams anticipate capacity issues, resource shortages, and performance trends.
For example, if storage usage is increasing faster than expected, the system can forecast when it will reach capacity, giving admins enough time to plan expansions or optimize workloads.
By offering predictive insights and scalable architecture, OpManager Plus helps IT teams stay ahead of infrastructure growth and avoid future bottlenecks.
Summary
As modern IT environments grow more complex with cloud, hybrid infrastructure, and distributed applications, traditional monitoring and manual troubleshooting are no longer sufficient. The evolution toward AIOps-driven IT operations is enabling organizations to move beyond reactive monitoring to intelligent, automated operations. By combining unified monitoring, advanced analytics, and automation, AIOps helps IT teams reduce alert noise, gain end-to-end observability, and resolve issues faster.
OpManager Plus plays a critical role in this transformation by delivering a unified platform that monitors networks, servers, applications, storage, virtualization, and cloud environments from a single console. With built-in AIOps capabilities such as anomaly detection, alert correlation, root-cause analysis, and automated remediation, OpManager Plus enables IT teams to operate more efficiently and proactively.
Wi-Fi Key Generator
Follow Firewall.cx
Recommended Downloads
Cisco Password Crack
Decrypt Cisco Type-7 Passwords on the fly!


