Measuring Network Performance: Test Network Throughput, Delay-Latency, Jitter, Transfer Speeds, Packet loss & Reliability. Packet Generation Using Iperf / Jperf
 Measuring network performance has always been a difficult and unclear task, mainly because most engineers and administrators are unsure which approach is best suited for their LAN or WAN network.
A common (and very simple) method of testing network performance is by initiating a simple file transfer from one end (usually workstation) to another (usually server), however, this method is frequently debated amongst engineers and there is good reason for that: When performing file transfers, we are not only measuring the transfer speed but also hard disk delays on both ends of the stream. It is very likely that the destination target is capable of accepting greater transmission rates than the source is able to send, or the other way around. These bottlenecks, caused by hard disk drives, operating system queuing mechanism or other hardware components, introduce unwanted delays, ultimately providing incorrect results.
The best way to measure the maximum throughput and other aspects of a network is to minimise the delay introduced by the machines participating in the test. High/Mid-end machines (servers, workstations or laptops) can be used to perform these tests, as long as they are not dealing with other tasks during the test operations.
While large companies have the financial resources to overcome all the above and purchase expensive equipment dedicated to testing network environments, the rest of us can rely on other methods and tools, most of which are freely available from the open source community.
Related articles:
- Complete Guide to Netflow: How Netflow & its Components Work. Netflow Monitoring Tools
- Netflow: Monitor Bandwidth & Network Utilization. Detect LAN, WAN, Wi-Fi Bottlenecks, Unusual Traffic Patterns, Problems and more
- Netflow vs SNMP. Two Different Approaches to Network Monitoring
Introducing Iperf
Iperf is a simple and very powerful network tool that was developed for measuring TCP and UDP bandwidth performance. By tuning various parameters and characteristics of the TCP/UDP protocol, the engineer is able to perform a number of tests that will provide an insight into the network’s bandwidth availability, delay, jitter and data loss.
Main features of Iperf include:
- TCP and UDP Bandwidth Measurement
- Reporting of Maximum Segment Size / Maximum Transmission Unit
- Support for TCP Window size
- Multi-threaded for multiple simultaneous connections
- Creation of specific UDP bandwidth streams
- Measurement of packet loss
- Measurement of delay jitter
- Ability to run as a service or daemon
- Option to set and interval to automate performance tests
- Save results and errors to a file (useful for reviewing results later)
- Runs under Windows, Linux OSX or Solaris
Unlike other fancy tools, Iperf is a command line program that accepts a number of different options, making it very easy and flexible to use. Users who prefer GUI based tools can download Kperf or Jperf, which are enhancement projects aimed to provide a friendly GUI interface for Iperf.
Another great thing about Iperf is that both ends do not require to be on the same type of operating system. This means that one end can be running on a Windows PC/Server while the other end is a Linux based system.
Currently supported operating systems are as follows:
- Windows 2000, XP, 2003, Vista, 7, 8 & Windows 2008
- Linux 32bit (i386)
- Linux 64bit (AMD64)
- MacOS X (Intel & PowerPC)
- Oracle Solaris (8, 9 and 10)
Downloading Iperf/Jperf for Windows & Linux - Compiling & Installing on Linux
Iperf is available as a free download from our Administrator Utilities download section. The downloadable zip file contains the Windows and Linux version of Iperf, along with the Java-based graphical interfaces (Jperf). Full installation instructions are available within the .zip file.
The Linux version is easily installed using the procedure outlined below. First step is to untar and unzip the file containing the Iperf application:
Next, enter the Iperf directory, configure, compile and install the application:
[root@Nightsky ~]# cd iperf-2.0.5
[root@Nightsky iperf-2.0.5]# ./configure
[root@Nightsky iperf-2.0.5]# make
<output omitted>
[root@Nightsky iperf-2.0.5]# make install
<output omitted>
Finally, clean the directory containing our compiled leftover files:
Iperf can be conveniently found in the /usr/local/bin/ directory on the Linux server or workstation.
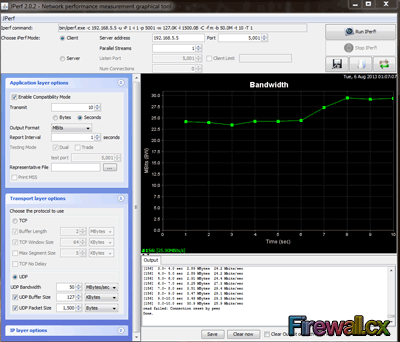
Below is a screenshot from the Windows GUI - Jperf application. Its friendly interface makes it easy to select bandwidth speed, protocol specific parameters, and much more, with just a few clicks. At the top of the GUI, Jperf will also display the CLI command used for the options selected - a neat feature:
Ideas On Unleashing Iperf – Detailed Examples On How To Use Iperf
Having a great tool like Iperf to measure network performance, packet loss, jitter and other characteristics of a network, opens a number of brilliant possibilities that can help an engineer not only identify possible pitfalls in their network (LAN or WAN), but also test different vendor equipment and technologies to discover real performance differences between them.
Here are a few ideas the Firewall.cx team came up with during our brainstorming session on Iperf:
- Measuring the network (LAN) backbone throughput.
- Measuring Jitter and packet loss across links. The jitter value is particularly important on network links supporting voice over IP (VoIP) because a high jitter can break a VoIP call.
- Test WAN link speeds and CIR – Is the Telco provider delivering the speeds we are paying for?
- Test router or firewall VPN throughput between links. By tuning IPSec encryption algorithms we can increase our throughput significantly.
- Test Access Point performance between clients. Wireless clients connect at 150Mbps or 300Mbps to an access point, but what are the maximum speeds that can be achieved between them?
- Test Client – Server bottlenecks. If there’s a server performance issue and we are not quite sure if its network related, Iperf can help shed light on the source of the problem, leaving out of the equation possible bottlenecks such as hard disk drives.
- Creating parallel data transfer streams to increase load on the network to test router or switch utilisation. By running Iperf on multiple workstations with multiple threads, we can create a significant amount of load on our network and perform various stress-tests.
At first sight, it is evident that Iperf is a tool that can be used to test any part of your network, whether it be Copper (UTP) links, fiber optic links, Wi-Fi, leased lines, VoIP infrastructure and much more.
Because every network has different needs and problems we thought it would be better to take a different approach to Iperf and, instead of presenting test results of our setups (LAB Environment), show how it can be used to test and diagnose different problems engineers are forced to deal with.
By having a firm understanding how to use the options supported by Iperf, engineers can tweak the commands to help them identify their own network problems and test their network performance.
For this reason, we have split this Iperf presentation by covering its various parameters. Note the parameters are case sensitive:
- Default Iperf Settings for Server and Client
- Communications Ports (-p), Interval (-i) and timing (-t)
- Data format report (Kbps, Mbps, Kbytes, Mbytes) (-f)
- Buffer lengths to read or write (-l)
- UDP Protocol Tests (-u) & UDP bandwidth settings (-b)
- Multiple parallel threads (-P)
- Bi-directional bandwidth measurement (-r)
- Simultaneous bi-directional bandwidth measurement (-d)
- TCP Window size (-w)
- TCP Maximum Segment Size (MSS) (-M)
- Iperf Help (-h)
Default Iperf Settings for Server and Client
Server Side
By default, Iperf server listens on TCP port 5001 with a TCP window size of 85Kbytes. When running Iperf in server mode under Windows, the TCP window size is set to 64Kbytes. The Iperf server is run using the following command:
Client Side
The Iperf client connects to the Iperf server at TCP port 5001. When running in client mode we must specify the Iperf server’s IP address. Iperf will run immediately and present its results:
Server Side Results
The server also provides the test results, allowing both ends to verify the results. In some cases there might be a minor difference in the bandwidth because of how it's calculated from each end:
Communications Ports (-p), Interval (-i) and Timing (-t)
The port under which Iperf runs can be changed using the –p parameter. The same value must be configured on both server and client side. The interval -i is a Server/Client parameter used to set the interval between periodic bandwidth reports, in seconds, and is very useful to see how bandwidth reports change during the testing period.
The timing parameter –t is client specific and specifies the duration of the test in seconds. The default is 10 seconds.
Server Side
Client Side
Server Side Results
Data Format Report (Kbytes & Kbps, Mbytes & Mbps) (-f) – Server/Client Parameter
Iperf can display the bandwidth results in different format, making it easy to read. Bandwidth measurements and data transfers will be displayed in the format selected.
Server side
Client Side
Here a test is performed on a 10Mbps link using default parameters. Notice the Transfer and Bandwidth report at the end:
Same test was executed with the –f k parameter so that Iperf would display the results in Kilobytes and Kbps format:
Buffer Lengths To Read Or Write (-l) – Server/Client Parameter
The buffer lengths are rarely used, however, they are useful when dealing with large capacity links such as local networks (LAN). The –l parameter specifies the length of buffer read/write for each side and is a client/server parameter. Values specified can be in K (Kbytes) or M (Mbytes). It’s best to always ensure both sides have the same buffer value set. The default length of read/write buffer is 8K.
Server Side
Client Side with default read/write buffer of 8K.
Note that for test, the Server side was not set, making it the default value of 8K.
Client Side with read/write buffer of 256K.
Note that, for this test, the Server side was set to the same buffer length value of 256K.
Client Side with read/write buffer of 20MB.
Note that, for this test, the Server side was set to the same buffer length value of 20MB. Notice the dramatic increase of Transfer and Bandwidth with a 20MB read/write buffer:
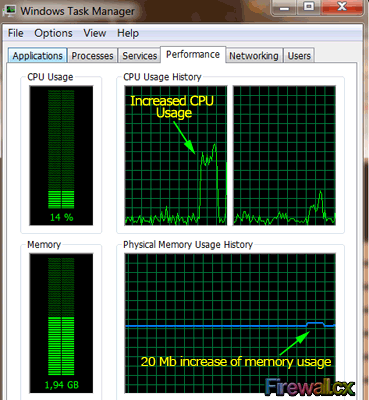
When running tests with large read/write buffers it is equally interesting to monitor the client’s or server’s CPU, memory and bandwidth usage.
Since the 20MB buffer is swapped to memory during the test there will be a noticeable increase of memory usage. Those curious can also try a much larger buffer such as 100MB to see how the system will respond. At the same time, CPU usage will also increase as it is handing the packets being generated and received. Our Dual-Core CPU handled the test without a problem, however, it doesn't take much to bring the system to its knees. For this reason it is highly advisable not run other heavy applications during the tests:

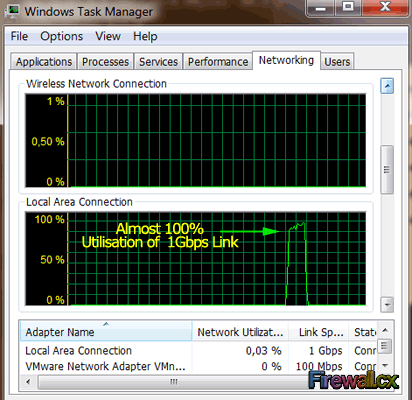
On the other hand, monitoring the network utilisation through the Windows Task Manager also helps provide a visual result of the network throughput test:

UDP Protocol Tests (-u) & UDP Bandwidth Settings (-b) – Important For VoIP Networks
The –u parameter is a Server/Client specific parameter.
VoIP networks are great candidates for this type of test and extremely important. UDP tests can provide us with valuable information on jitter and packet loss. Jitter is the latency variation and does not depend on the latency itself. We can have high response times and low jitter values without introducing VoIP communications problems. High jitter can cause serious problems to VoIP calls and even break them.
The UDP test also measures the packet loss of your network. A good quality link must have a packet loss less than 1%.
The –b parameter is client specific and allows us to specify the bandwidth to send in bits/sec. The useful combination of –u and –b allows us to control the rate at which data is sent across the link being tested. The default value is 1Mbps.
Server Side
Client Side
The following command instructs our client to send UDP data at the rate of 10Mbps:
It is important to note that the Iperf client presents its local and remote Iperf server statistics. While the client reports that it was able to send data at the rate of 9.89Mbps, the server reported it was receiving data at the rate of 4.39Mbps, clearly indicating a problem in our link.
Next in the server’s bandwidth report (4.39Mbps) are the jitter and packet loss statistics. The jitter was measured at 0.218msec – an acceptable delay, however, the 56% packet loss is totally unacceptable and explains why the server received slightly less than half (4.39Mbps) of the transmitted rate of 9.89Mbps.
When tests reveal possible network problems it is always best to re-run the test to determine if packet loss is constant or happens at specific times during the total transfer. This information can be revealed by repeating the Iperf command but including the –i 2 parameter, which instructs our client to send UDP data at the rate of 10Mbps and sets interval between periodic bandwidth reports to 2 seconds:
Client Side
The results with 2 second interval reporting show that there was a significant drop in transmission speed a bit later than half way through the test, between 6 and 10 seconds. If this was a leased line or Frame Relay link, it would most likely indicate that we are hitting our CIR (Committed Information Rate) and the service provider is slowing down our transmission rates.
Multiple Parallel Threads (-P) - Client Specific Parameter
The multiple parallel thread parameter –P is client specific and allows the client side to run multiple threads at the same time. Obviously, using this parameter would divide the bandwidth to the amount of threads running and it's considered a valuable parameter when testing QoS functionality. We combined it with the –l 4M parameter to increase the read/write buffer to 4MB, increasing the performance on both ends.
Server Side
Client Side
Individual Bi-directional Bandwidth Measurement (-r) - Client Specific Parameter
The bi-directional parameter –r forces an individual bi-directional test, forcing the client to become the server after its initial test is complete. This option is considered very useful when it is necessary to test the performance in both directions and saves us manually switching the roles between the client and server.
Server Side
Client Side
Notice the two connections created, one for each direction. A similar report is generated on the server’s side.
Simultaneous Bi-directional Bandwidth Measurement (-d) – Client Specific
The simultaneous bi-directional bandwidth measurement parameter –d is client specific and forces a simultaneous two way data transfer test. Think about is as a full-duplex test between the server and client. This test is great for leased line WAN links which offer synchronous download/upload speeds.
We tested it between our Linux server and Windows 7 client using the –l 5M parameter, to increase the send/receive buffer and test out speeds through a 100Mbit link.
Server Side
Client Side
We can see the two sessions [4 & 5] created between our two endpoints along with their results – an average of 81,6Mbps ( (73.2+90) / 2), falling slightly short of our expectations of our 100Mbps test link.
TCP Window Size (-w) – Server/Client Parameter
The TCP Window size can be set using the –w parameter. The TCP Window size represents the amount of data that can be sent from the server without the receiver being required to acknowledge it. Typical values are between 2 and 65,535bytes. The default value is 64KB.
Firewall.cx has covered the TCP Window size concept in great depth. Readers can refer to our TCP Windows Size article to understand its importance and how it can help increase throughput on links with increased latency e.g Satellite links.
Server Side
On Linux, when specifying a TCP Window size, the kernel allocated double that requested. Ironically, the Windows operating system allowed a 1MB and even 5MB window size without any problem.
Client Side
Using a 4KB TCP Window size gave us only 40.1Mbps - half of our potential 100Mbps link. When we increased this to 64KB, we managed to squeeze out 93.9Mbps throughput!
TCP Maximum Segment Size (MSS) (-M) - Server/Client Parameter
The Maximum Segment Size (mss) is the largest amount of data, in bytes, that a computer can support in a single unfragmented TCP segment. Readers interested in understanding the importance of mss and how it works can refer to our TCP header analysis article.
If the MSS is set too low or high it can greatly affect network performance, especially over WAN links.
Below are some default values for various networks:
Server Side
Client Side
Iperf Help –(h)
While we’ve covered most of the Iperf supported parameters, there are still more readers can discover and work with. Using the iperf –h command will reveal all available options:
In this article we showed how IT Administrators, IT Managers and Network Engineers can use IPerf to correctly test their network throughput, network delay, packet loss and link reliability.
Wi-Fi Key Generator
Follow Firewall.cx
Recommended Downloads
Cisco Password Crack
Decrypt Cisco Type-7 Passwords on the fly!


