Network Management Systems Help Businesses Accurately Monitor Important Application Performance, Infrastructure Metrics, Bandwidth, SLA Breaches, Delay, Jitter and more
Accurately monitoring your organization’s business application performance, service provider SLA breaches, network infrastructure traffic, bandwidth availability, Wi-Fi capacity, packet loss, delay, jitter and other important metrics throughout the network is a big challenge for IT Departments and IT Managers. Generating meaningful reports for management with the ability to focus on specific metrics or details can make it an impossible task without the right Network Management System.
The continuous demand for businesses network infrastructure to support, uninterrupted, more applications, protocols and services has placed IT departments, IT Managers and, subsequently, the infrastructure they manage, under tremendous pressure. Knowing when the infrastructure is reaching its capacity and planning ahead for necessary upgrades is a safe strategy most IT Departments try to follow.
The statistics provided by the Cisco Visual Networking (CVN) Index Forecast predict an exponential growth in bandwidth requirements the coming 5 years:

These types of reports, along with the exponential growth of bandwidth & speed requirements for companies of all sizes, raises a few important questions for IT Managers, Network Administrators and Engineers:
- Is your network ready to accommodate near-future demanding bandwidth requirements?
- Is your current LAN infrastructure, WAN and Internet bandwidth sufficient to efficiently deliver business-critical applications, services and new technologies such as IoT, Wi-Fi - 802.11n and HD Video?
- Do you really receive the bandwidth and SLA that you have signed for with your internet service provider or are the links underutilized and you are paying for expensive bandwidth that you don’t need?
- Do you have the tools to monitor network conditions prior to potential issues becoming serious problems that impact your business?
All these questions and many more are discussed in this article aiming to help businesses and IT staff understand the requirements and impact of these technologies on the organization’s network and security infrastructure.
We show solutions that can be used to help obtain important metrics, monitor and uncover bottlenecks, SLA breaches, security events and other critical information.
Key Topics:
- Network Performance Metrics and their Bandwidth Impact
- New Applications and Bandwidth Requirements
- High Definition (HD) Video Bandwidth Requirements
- BYOD and 802.11n Bandwidth Requirements
- Virtual Desktop Infrastructure (VDI) Bandwidth Requirements
- Cloud IP Traffic Statistics
- Application Bandwidth Requirements and Traffic Patterns
- Network Monitoring Systems for Bandwidth & Metric Monitoring
- ManageEngine OpManager12 NMS features
- Bandwidth Monitoring
- Router Traffic Monitoring
- Cisco AVC Monitoring
- Advanced Security Analytics
- Cisco IPSLA Monitoring
- Cisco NBAR Reporting
- ManageEngine OpManger12 trial version installation
- Summary
Finally, we must point out that basic knowledge of the Networking and Design concepts is recommended for this article.
Network Performance Metrics and their Bandwidth Impact
Network performance metrics vary from business to business and provide the mechanism by which an organization measures critical success factors.
The most important performance metrics for business networks are as follows:
- Connectivity (one-way)
- Delay (both round-trip and one-way)
- Packet loss (one-way)
- Jitter (one-way) or delay variation
- Service response time
- Measurable SLA metrics
Bandwidth is one of the most critical variables of an IT infrastructure that can have a major impact to all the aforementioned performance metrics. Bandwidth over saturated links can cause poor network performance with high packet loss, excessive delay, and jitter which can result in lost productivity and revenue, and increased operational costs.
New Applications and Bandwidth Requirements
This rapid growth for bandwidth affects the Enterprises and Service Providers which are continually challenged to efficiently deliver business-critical applications and services while running a network at optimum performance. The necessity for more expensive bandwidth solutions is one of the crucial factors that may have a major impact on a network and applications performance. Let’s have a quick look at the new technologies with high bandwidth needs which require careful bandwidth and infrastructure planning:
High Definition (HD) Video Bandwidth Requirements
This surpassed standard definition by the end of 2011. User demand for HD video has a major impact on a network due to the demanding bandwidth requirements as clearly displayed below:

DVD, 720p HD and 1080p HD bandwidth requirements:
- (H.264) 720p HD video requires around 2,5 Mbps or twice as much bandwidth as (H.263) DVD
- (H.264) 1080p HD video requires around 5Mbps or twice as much bandwidth as (H.264) 720p
- Ultra HD 4320p video requires around 20Mbps or four times as much bandwidth as (H.264) 1080p
BYOD and 802.11ac Bandwidth Requirements
802.11ac is the next generation of Wi-Fi. It is designed to give enterprises the tools to meet the demands of BYOD access, high bandwidth applications, and the always-on connected user. The 802.11ac IEEE standard allows for theoretical speeds up to 6.9 Gbps in the 5-GHz band, or 11.5 times those of 802.11n!
Taking into consideration the growing trend and adoption of Bring-Your-Own-Device (BYOD) access, it won’t be long until multi-gigabit Wi-Fi speeds will become necessary.
Virtual Desktop Infrastructure (VDI) Bandwidth Requirements
Each desktop delivered over WAN can consume up to 1 Mbps bandwidth and considerably more when employees access streaming video. In companies with many virtual desktops, traffic can quickly exceed existing WAN capacity, noticeably degrading the user experience.
Cloud IP Traffic Statistics
The Annual global cloud IP traffic will reach 14.1 ZB (1.2 ZettaBytes per month) by the end of 2020, up from 3.9 ZB per year (321 ExaBytes per month) in 2015.
Annual global data center IP traffic will reach 15.3 ZB (1.3 ZB per month) by the end of 2020, up from 4.7 ZB per year (390 EB per month) in 2015. These forecasts are provided by the Cisco Global Cloud Index (GCI) which is an ongoing effort to forecast the growth of global data center and cloud-based IP traffic.
Application Bandwidth Requirements and Traffic Patterns
Bandwidth requirements and traffic pattern are not common among various applications and need careful planning as displayed below:
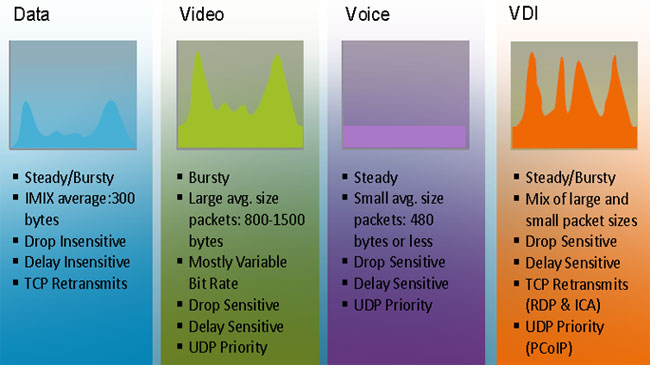
Data, Video, Voice and VDI bandwidth requirements & traffic patterns
An effective strategy is essential in order to monitor network conditions prior to potential issues becoming serious problems. Poor network performance can result in lost productivity, revenue, and increased operational costs. Hence, detailed monitoring and tracking of a network, applications, and users are essential in optimizing network performance.
Network Monitoring Systems (NMS) for Bandwidth Monitoring
An NMS solution needs to keep track of what is going on in terms of link bandwidth utilization and whether it is within the normal (baseline) limits. In addition, network and device monitoring helps network operators optimize device security either proactively or in a fast, reactive approach. Standard monitoring protocols such as Simple Network Management Protocol (SNMP) and NetFlow make the raw data needed to diagnose problems readily available. Finally, historical network statistics is an important input to the calculations when planning for a bandwidth upgrade.
SNMP can easily provide essential network device information, including bandwidth utilization. In particular, the NMS can monitor bandwidth performance metrics such as backplane utilization, buffer hits/misses, dropped packets, CRC errors, interface collisions, interface input/output bits, & much more periodically via SNMP.
Network devices can be monitored via SNMP v1, 2c, or 3 and deliver bandwidth utilization for both inbound and outbound traffic. XML-API can be used to monitor and collect bandwidth statistics information from supported devices such as the CISCO UCS Manager. In addition, Network maps with bandwidth utilization graphs can visualize the flow of bandwidth and spot bottlenecks at a glance.
Bandwidth issues reported by users regarding delays and slow response to applications cannot be identified with only SNMP based information. It needs technologies such as Cisco NBAR, Netflow, Juniper J-Flow, IPFIX, sFlow, Huawei NetStream or CBQOS to understand the bandwidth utilization across applications, users and devices. With these technologies, monitoring is possible to perform in-depth traffic analysis and determine in detail the who, what, when and where of bandwidth usage.
Finally, performance thresholds and reporting topN devices with specific characteristics (TopN reporting) are useful, both for noticing when capacity is running out, and for easily correlating service slowness with stressed network or server resources. Those metrics can be the first indication of an outage, or of potential SLA deterioration to the point where it affects delivery of services.
ManageEngine OpManager12 NMS Features
OpManager is the NMS product offered by Manage Engine. OpManager can be easily installed and deployed, and provide all the visibility and control that you need over your network.
In brief, it offers the following main features:
- Physical and virtual server monitoring
- Flow-based bandwidth analysis
- Firewall log analysis and archiving
- Configuration and change management
- IP address and switch port management
The tools mentioned below are needed for insight visibility of the bandwidth network performance. They can assist you to prepare your network for the deployment of new technologies and to measure the network performance indexes that we discussed in the previous sections. In particular, it offers the following tools to achieve complete network bandwidth visibility:
Bandwidth Monitoring: Tracks network bandwidth usage in real-time and provides info for the topN users consuming bandwidth on a network.
Router Traffic Monitoring: Continuously monitors networking devices using flows and generates critical information to ensure proper network bandwidth usage.
Cisco AVC Monitoring: in-depth visibility on the bandwidth consumption per application. Ensure business critical applications get maximum priority. Forecast future bandwidth needs and prepare your network before deploying new services and technologies.
Advanced Security Analytics Module: Detect threats and attacks using continuous Stream Mining Engine technology. This ensures high network security and a method to detect and eliminate network intruders.
Cisco IPSLA Monitoring: Monitor critical metrics affecting VoIP, HD Video performance, VDI and ensure best-in-class service levels. Ensure seamless WAN connectivity through WAN RTT monitoring.
Cisco NBAR Reporting: Recognize a wide variety of applications that use dynamic ports. Classify and take appropriate actions on business critical and non-critical applications.
ManageEngine OpManager-12 Trial Version Installation
The installation of OpManger12 trial version is discussed in this section. The installation is very simple and fast. We didn’t take more than 5 minutes to install it.
Two options are provided during the installation:
- 30 days trial without any limitation to the number of the devices and interfaces
- Free edition where you can monitor up to 10 devices
We installed the 30-day trial version. You can easily uninstall the trial version in less than 2 minutes after the product evaluation, by following the OpManager uninstall wizard. Let’s rock!
We start by downloading the Windows or Linux installation file of OpManager from the following link:
Downloading OpManager for Windows or Linux systems (Click to download)
Once downloaded run the file to initiate the Install Wizard which guides us through the installation process.
After accepting the license agreement it is necessary to select the installation mode to test the ManageEngine OpManager 12. We selected the 30 days trial version, which is more than enough for evaluation:
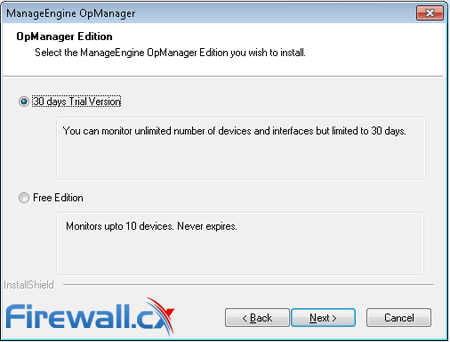
Selecting between OpManager 30 Day Trial or Free Edition
Next, we select the language and path for the installation followed by the recommended ports required for OpManager. In particular, port 80 is the default server port of OpManager and port 9996 is the default port to listen for netflow packets. The ports can be easily changed during the installation.
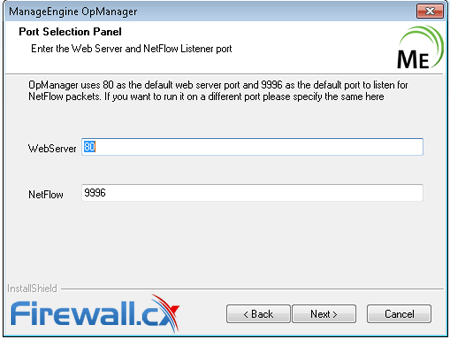
Selecting and changing OpManager WebServer and NetFlow ports
Next, we skip the Registration for Technical Support since we don’t require it for the evaluation of the product. OpManager will now commence its installation process.
When the file copy process is complete, we are prompted to select whether we are installing a Primary or Standby server. Redundancy is not required for our product evaluation:
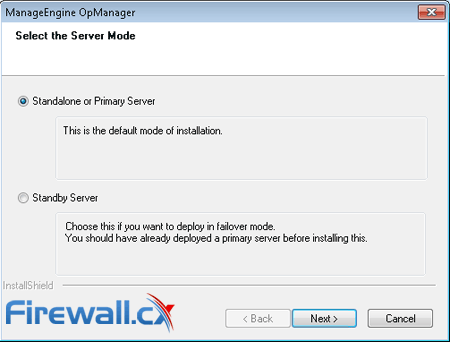
Selecting between Primary and Standby OpManager Installation
The next option allows the installation of OpManager using MSSQL or POSTGRESQL which is the fastest installation option. POSTGRESQL is bundled with the product and is a great option for evaluation cases:
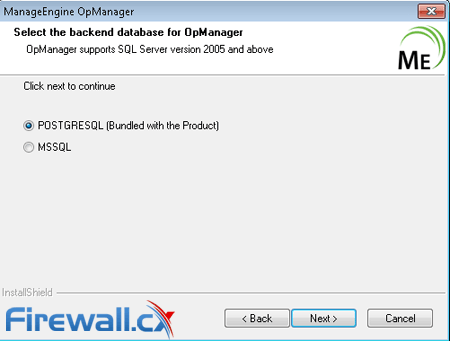
Selecting between OpManager with PostgreSQL or MSSQL
We managed to complete the installation process in less than 3 minutes!
As soon as we hit the Finish button, the initialization of the modules starts. Meanwhile we can take a quick look at the Readme file which includes useful information about the product.
OpManager launches in less than a minute after completing its initialization. The welcome tour introduces us to the main functionalities of the product:
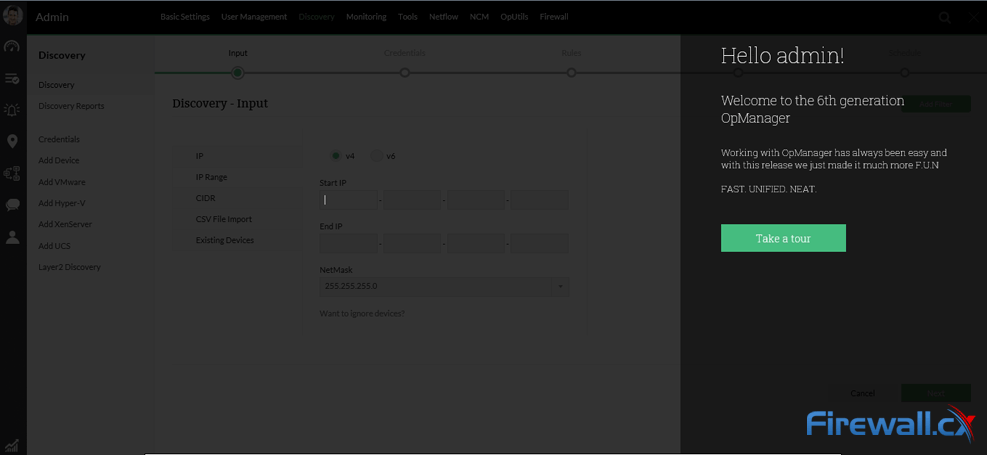
OpManager’s welcome tour
We are ready now to start working and discover this product. You can start by discovering your network devices. It is a powerful tool with plenty of capabilities.
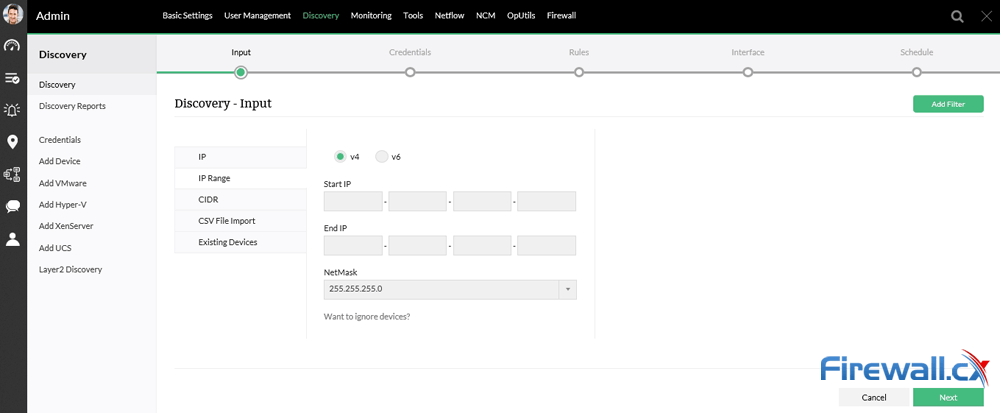
OpManager Network Device Discovery
Selecting the overview tab from the left column we see (screenshot below) useful information about Network, Server, Virualization, Netflow, Network Configuration Management (NCM), Firewall and IP address Management (IPAM). All the essential components that should be monitored in a network:
NOTE: The single discovered device shown is by default the Server where OpManager is installed.
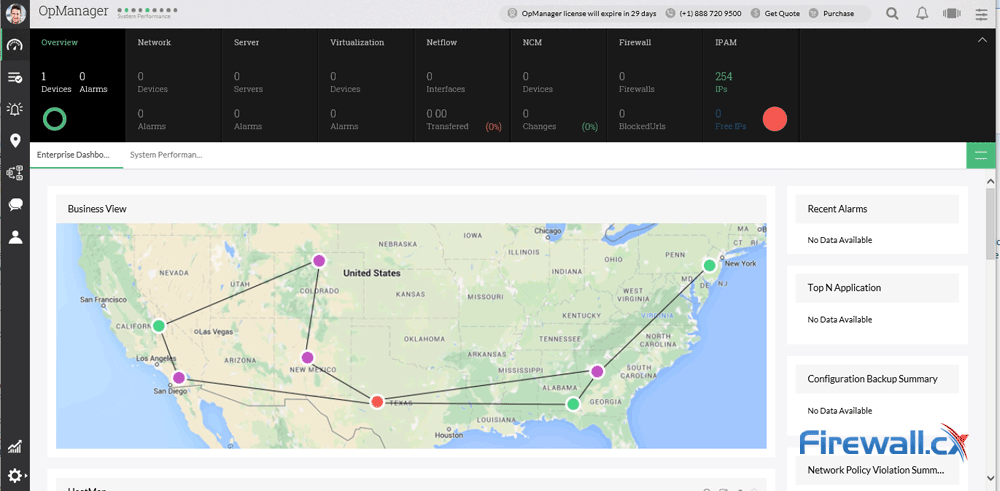
OpManager discovered devices and network view
All installed features and application add-ons enabled for the 30 day evaluation period are shown:
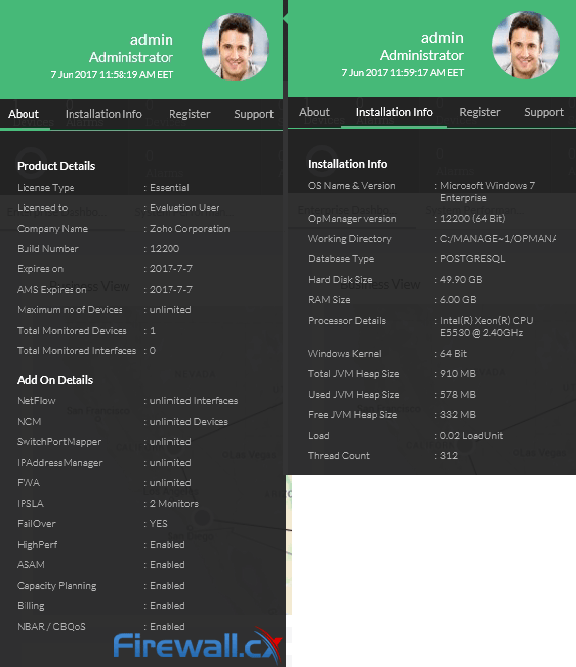
OpManager installed options and product details
Summary
Bandwidth availability is a critical factor that has a major impact on a network and also affects application performance. The introduction of new IT technologies & policies, such as BYOD and HD-Video etc, requires careful planning, provisioning and monitoring by a sophisticated reputable NMS. The NMS should not only monitor bandwidth utilization but also perform in-depth traffic analysis and determine in detail the who, what, when and where of bandwidth usage. OpManger12 is the NMS solution that includes all the tools for bandwidth and application monitoring by utilizing NBAR, Netflow, SNMP and XML-API technologies, helping IT Departments and IT Managers get centralized visibility of their network that was previously impossible.
Wi-Fi Key Generator
Follow Firewall.cx
Recommended Downloads
Cisco Password Crack
Decrypt Cisco Type-7 Passwords on the fly!


