Minimise Internet Security Threats, Scan & Block Malicious Content, Application Visibility and Internet Usage Reporting for Businesses
 For every business, established or emerging, the Internet is an essential tool which has proved to be indispensable. The usefulness of the internet can be counteracted by abuse of it, by a business’s employees or guests. Activities such as downloading or sharing illegal content, visiting high risk websites and accessing malicious content are serious security risks for any business.
There is a very easy way of monitoring, managing and implementing effective Internet usage. GFI WebMonitor can not only provide the aforementioned, but also provide real – time web usage. This allows for tracking bandwidth utilisation and traffic patterns. All this information can then be presented on an interactive dashboard. It is also an effective management tool, providing a business with the internet usage records of its employees.
Such reports can be highly customised to provide usage information based on the following criteria/categories:
- Most visited sites
- Most commonly searched phrases
- Where most bandwidth is being consumed
- Web application visibility
Some of the sources for web abuse that can be a time sink for employees are social media and instant messaging (unless the business operates at a level where these things are deemed necessary). Such web sites can be blocked.
GFI WebMonitor can also achieve other protective layers for the business by providing the ability to scan and block malicious content. WebMonitor helps the business keep a close eye on its employees’ internet usage and browsing habits, and provides an additional layer of security.
On its main dashboard, as shown below, the different elements help in managing usage and traffic source and targets:
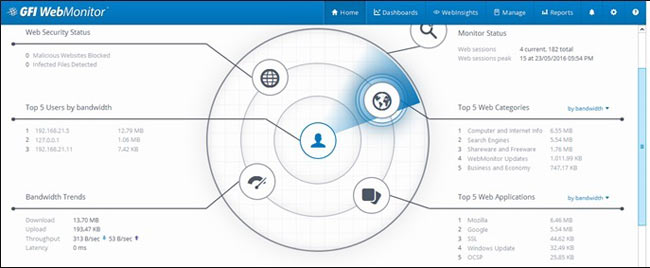
Figure 1. WebMonitor’s Dashboard provides in-depth internet usage and reporting
WebMonitor’s main dashboard contains a healthy amount of information allowing administrators and IT managers to obtain important information such as:
- See how many Malicious Sites were blocked and how many infected files detected.
- View the Top 5 Users by bandwidth
- Obtain Bandwidth Trends such as Download/Upload, Throughput and Latency
- Number of currently active web sessions.
- Top 5 internet categories of sites visited by the users
- Top 5 Web Applications used to access the internet
Knowing which applications are used to access the internet is very important to any business. Web applications like YouTube, Bittorrent, etc. can be clearly identified and blocked, providing IT managers and administrators a ringside view of web utilisation.
On the flip side, if a certain application or website is blocked and a user tries to access it, he/she will encounter an Access Denied page rendered by GFI WebMonitor. This notification should be enough for the user to be deterred from trying it again:
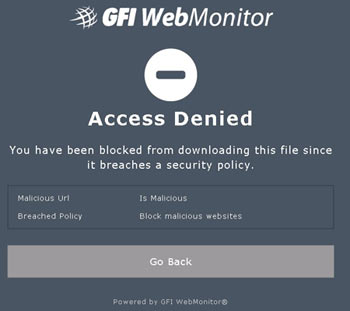
Figure 2. WebMonitor effectively blocks malicious websites while notifying users trying to access it
For the purpose of this article, a deliberate attempt was made to download an ISO file using Bittorent. As per the policy the download page was part of the block policy. Hence GFI WebMonitor not only blocked the user from accessing the file, it also displayed the violation stating the user’s machine IP Address and the policy that was violated. This is a clear demonstration of how the management of web application can be effective.
Some of the other great dashboards include bandwidth insight. The following image shows the total download and upload for a specific period. The projected values and peaks can be easily traced as well.
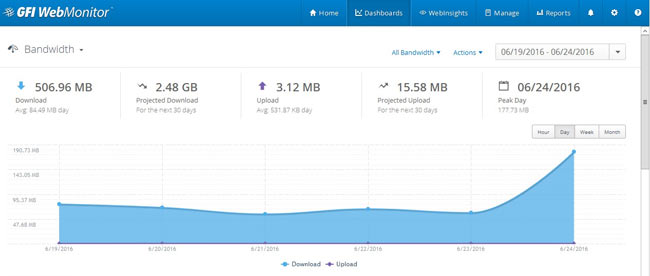 Figure 3. WebMonitor’s Bandwidth graphs help monitor the organisation’s upload/download traffic (click to enlarge)
Another useful dashboard is that of activity. This provides information about total users, their web request, and a projection of the next 30 days, as shown in the following image:
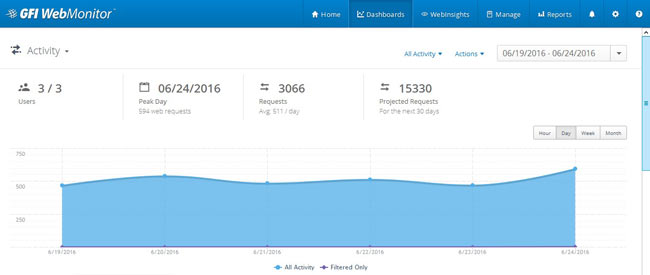 Figure 4. WebMonitor allows detailed tracking of current and projected user web requests with very high accuracy (click to enlarge)
The Security dashboard is perhaps one of the most important. This shows all the breaches based on category, type and top blocked web based applications that featured within certain policy violations.
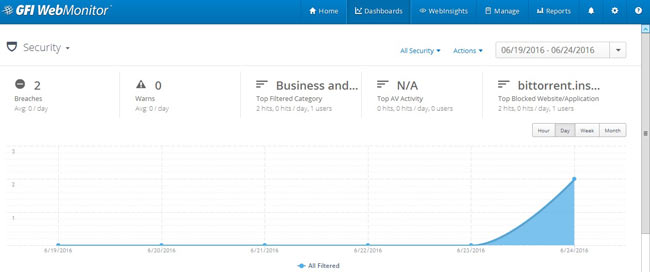 Figure 5. The Security dashboard allows tracking of web security incidents and security policy violations (click to enlarge)
Running Web Reports
The easiest way to manage and produce the information gathered is to run reports. The various categories provided allow the user to run and view information of Internet usage depending on management requirements. The following image shows the different options available on the left panel:
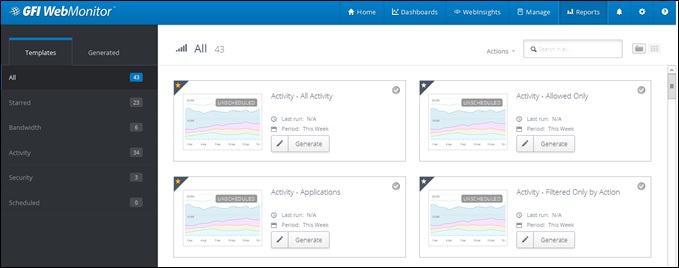 Figure 6. WebMonitor internet web usage reports are highly customisable and provide detailed information (click to enlarge)
But often management would rather take a pulse of the current situation. GFI WebMonitor caters to that requirement very well. The best place to look for instant information regarding certain key aspects of resource usage is the Web Insights section.
If management wanted to review the bandwidth information, the following dashboard would give that information readily:
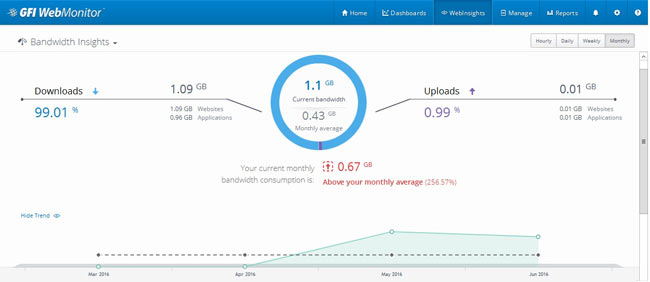 Figure 7. The Web Insight section keeps an overall track of internet usage (click to enlarge)
This provides a percentage view of how much data contributes to download or upload.
Security Insights shows all current activities and concerns that needs attention:
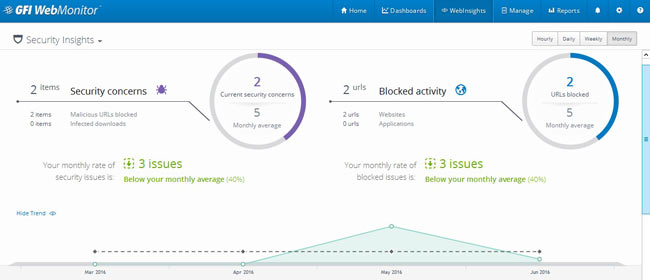 Figure 8. WebMonitor Security Insights dashboard displaying important web security reports (click to enlarge)
Conclusion
There is no doubt GFI WebMonitor becomes a very effective tool that allows businesses to monitor and control internet access for employees, guests and other internet users. Its intuitive interface allows administrators and IT Managers to quickly obtain the information they require but also put the necessary security policies in place to minimise security threats and internet resource abuse.
Wi-Fi Key Generator
Follow Firewall.cx
Cisco Password Crack
Decrypt Cisco Type-7 Passwords on the fly!


