How to Detect Routing Loops and Physical Loops with a Network Analyzer
 When working with medium to large scale networks, IT departments are often faced dealing with network loops and broadcast storms that are caused by user error, faulty network devices or incorrect configuration of network equipment. Network loops and broadcast storms are capable of causing major network disruptions and therefore must be dealt with very quickly.
There are two kinds of network loops and these are routing loops and physical loops.
Routing loops are caused by the incorrect configuration of routing protocols where data packets sent between hosts of different networks, are caught in an endless loop travelling between network routers with incorrect route entries.
A Physical loop is caused by a loop link between devices. A common example is two switches with two active Ethernet links between them. Broadcast packets exiting the links on one switch are replicated and sent back from the other switch. This is also known as a broadcast storm.
Both type of loops are capable of causing major network outages, waste of valuable bandwidth and can disrupt network communications.
We will show you how to detect routing loop and physical loop with a network analyzer such as Colasoft Capsa or Wireshark.
Note: To capture packets on a port that's connected to a Cisco Catalyst switch, users can also read our Configuring SPAN On Cisco Catalyst Switches - Monitor & Capture Network Traffic/Packets
If there are routing loops or physical loops in the network, Capsa will immediately report them in the Diagnosis tab as shown below. This makes troubleshooting easier for network managers and administrators:
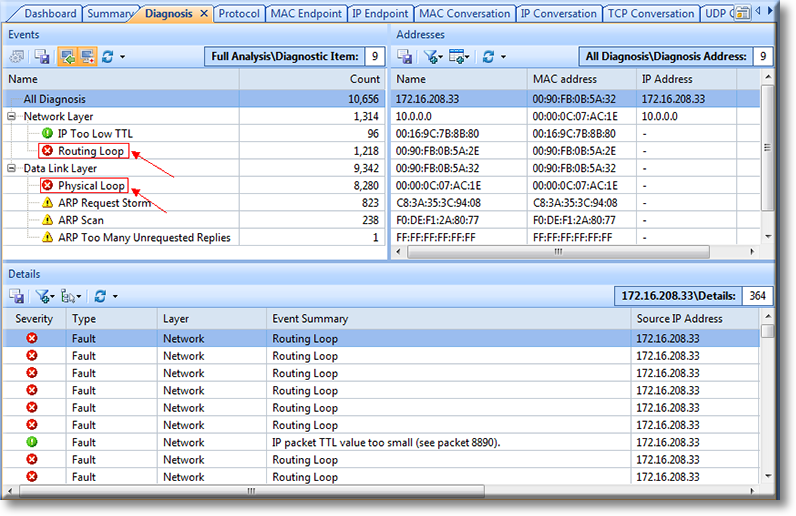
Figure 1. Capsa quickly detects and displays Routings and Physical Loops
Further examination of Capsa’s findings is possible by simply clicking on each detected problem. This allows us to further check the characteristics of the related packets and then decide what action must be taken to rectify the problem.
Visit our Network Protocol Analyzer Section for high-quality technical articles covering Wireshark topics, detecting and creating different type of network attacks plus many more great security articles.
Drilling Into Our Captured Information
Let’s take a routing loop for example. First, find out the related conversation using Filter (red arrow) in the MAC Conversation tab. MAC addresses can be obtained easily from the notices given in the Diagnosis tab:

Figure 2. Obtaining more information on a Routing Loop problem
Next, Double-click the conversation to load all related packets and additional information. Click on Identifier, to view the values of all packets under the Decode column, which in our case are all the same, This effectively means that the packets captured in our example is the same packet which is continuously transiting our network because its caused in a loop. For example, Router-A might be sending it to Router-B, which in turn sends it back to Router-A.
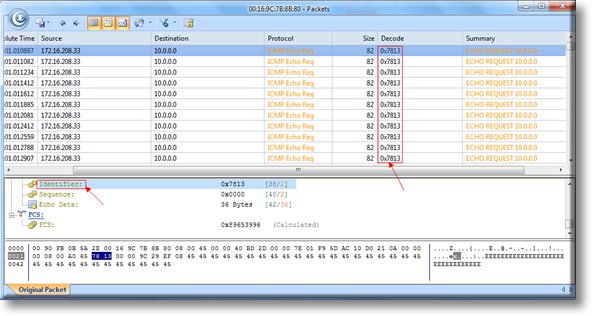
Figure 3. Decoding packets caught in a routing loop
Now click on the Time To Live section below, and you’ll see the Decode value reduces gradually. It is because that TTL value will decreased by 1 after transiting a routing device. When TTL reaches the value of 1, the packet will be discarded, to help avoid ICMP packets travelling indefinitely in case of a routing loop in the network. More information on the ICMP protocol can be found in our ICMP Protocol page:
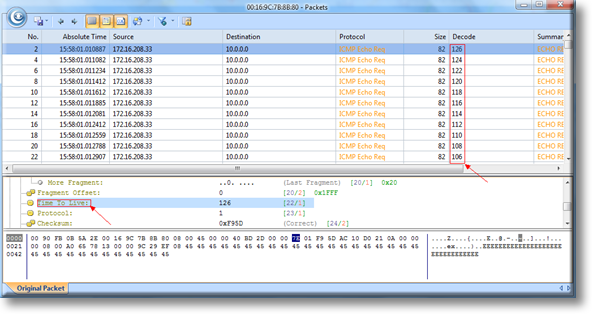
Figure 4. Routing loop causing ICMP TTL to decrease
The method used to analyze physical loops is almost identical, but the TTL values of all looped packets remain the same, instead of decreasing as we previously saw. Because the packet is trapped in our local network, it doesn’t traverse a router, therefore the TTL does not change.
Below we see a DNS Query packet that is trapped in a network loop:
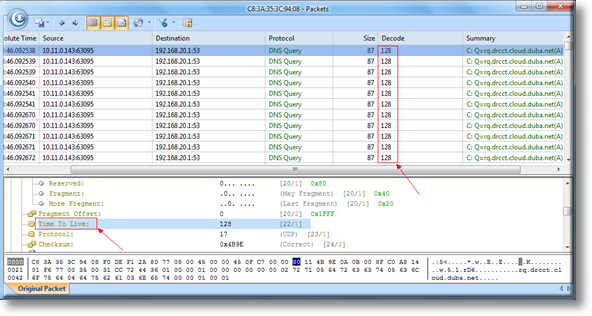
Figure 5. Discovering Network loops and why their TTL values do not decrease
Advanced network analyzers allows us to quickly detect serious network problems that can cause network outages, packet loss, packet flooding and more.
Wi-Fi Key Generator
Follow Firewall.cx
Recommended Downloads
Cisco Password Crack
Decrypt Cisco Type-7 Passwords on the fly!


