
You may be a user at home, a user in a LAN (local area network), or a system administrator of a large network of computers. Alternatively, you may be maintaining a large number of servers with multiple hard drives. Whatever may be your function, monitoring your Linux system is of paramount importance to keep it running in top condition.
While monitoring a complex computer system, some of the basic things to be kept in mind are the utilization of the hard disk, memory or RAM, CPU, the running processes, and the network traffic. Analysis of the information made available during monitoring is necessary, since all the resources are limited. Reaching the limits or exceeding them on any of the resources could lead to severe consequences, which may even be catastrophic.
Use a simple command like:
This results in the output:
Filesystem Size Used Avail Use% Mounted on
/dev/sda1 22G 5.0G 16G 24% /
/dev/sda2 34G 23G 9.1G 72% /home
This shows there are two partitions (1 & 2) of the hard disk sda, which are currently at 24% and 72% utilization. The total size is shown in gigabytes (G). How much is used and balance available is shown as well. However, checking each hard disk to see the percentage used can be a big drag. It is better that the system checks the disks and informs you by email if there is a potential danger. Bash scripts may be written for this and run at specific times as a cron job.
For the GUI, there is a graphical tool called ‘Baobab’ for checking the disk usage. It shows how a disk is being used and displays the information in the form of either multicolored concentric rings or boxes.
RAM or memory is used to run the current application. Under Linux, there are a number of ways you can check the used memory space -- both in static and dynamic conditions.
For a static snapshot of the memory, use ‘free -m’ which results in the output:
Mem: 1998 1896 101 0 59 605
-/+ buffers/cache: 1231 766
Swap: 290 77 213
Here, the total amount of RAM is depicted in megabytes (MB), along with cache and swap. A somewhat more detailed output can be obtained by the command ‘vmstat’:
However, if a dynamic situation of what is happening to the memory is to be examined, you have to use ‘top’ or ‘htop’. Both will give you a picture of which process is using what amount of memory and the picture will be updated periodically. Both ‘top’ and ‘htop’ will also show the CPU utilization, tasks running and their PID. Whereas ‘top’ has a purely numerical display, ‘htop’ is somewhat more colorful and has a semi-graphic look. There is also a list of command menus at the bottom for set up and specific operations.
For a graphical display of how the memory is being utilized, the Gnome System Monitor gives a detailed picture. There are other system monitors available under various window managers in Linux.
You may have a single, a dual core, or a quad core CPU in your system. To see what each CPU is doing or how two CPUs are sharing the load, you have to use ‘top’ or ‘htop’. These command line applications show the percentage of each CPU being utilized. You can also see process statistics, memory utilization, uptime, load average, CPU status, process counts, and memory and swap space utilization statistics.
Similar output statistics may be seen by using command line tools such as the ‘mpstat’, which is part of a group package called ‘sysstat’. You may have to install ‘sysstat’ in your system, since it may not be installed by default. Once installed, you can monitor a variety of parameters, for example compare the CPU utilization of an SMP system or multi-processor system.
Finding out if any specific process is hogging the CPU needs a little more command line instruction such as:
OR
Similar output can be obtained by using the command ‘iostat’ as root:
This will show three outputs every five seconds and show the information since the last reboot.
CPU usage under GUI is very well depicted by the Gnome System Monitor and other system monitoring applications. These are also useful for monitoring remote servers. Detailed memory maps can be accessed, signals can be sent and processes controlled remotely.
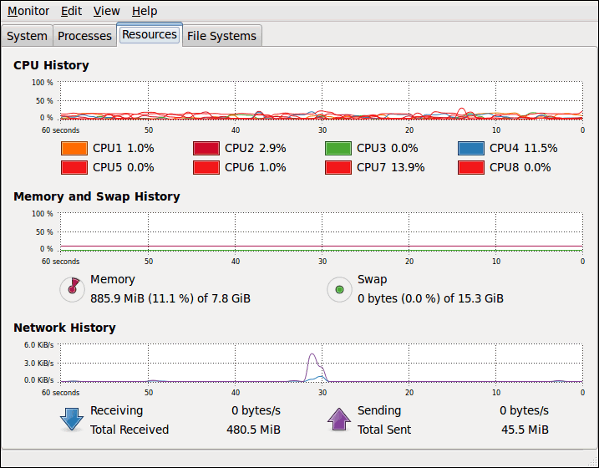
Gnome-System-Monitor
How do you know what processes are currently running in your Linux system? There are innumerable ways of getting to see this information. The handiest applications are the old faithfuls - ‘top’ and ‘htop’. They will give a real-time image of what is going on under the hood. However, if you prefer a more static view, use ‘ps’. To see all processes try ‘ps -A’ or ‘ps -e’:
root@gateway [~]# ps -e
PID TTY TIME CMD
1 ? 00:01:41 init
3201 ? 00:00:00 leechprotect
3208 ? 00:00:00 httpd
3360 ? 00:00:00 httpd
3490 ? 00:00:00 httpd
3530 ? 00:00:00 httpd
3532 ? 00:00:00 httpd
3533 ? 00:00:00 httpd
3535 ? 00:00:00 httpd
3575 ? 00:00:00 httpd
3576 ? 00:00:00 httpd
3631 ? 00:00:00 imap
3694 ? 00:00:00 httpd
3705 ? 00:00:00 httpd
3770 ? 00:00:00 imap
3774 pts/0 00:00:00 ps
5407 ? 00:00:13 dovecot
5408 ? 00:00:12 dovecot-auth
5416 ? 00:00:10 pop3-login
5417 ? 00:00:49 pop3-login
5418 ? 00:00:01 imap-login
5419 ? 00:00:04 imap-login
9745 ? 00:00:01 lfd
11501 ? 00:01:35 spamd
23948 ? 00:00:05 exim
23993 ? 00:01:00 spamd
24477 ? 00:00:04 queueprocd
24494 ? 00:01:20 tailwatchd
24526 ? 00:00:00 cpdavd
24536 ? 00:00:02 cpanellogd
24543 ? 00:00:33 cpsrvd-ssl
25952 ? 00:20:17 named
26374 ? 00:00:00 udevd
28524 ? 00:00:00 sshd
28531 pts/0 00:00:00 bash
29834 ? 00:00:00 sshd
30426 ? 00:11:27 syslogd
30429 ? 00:00:00 klogd
30473 ? 00:00:00 xinetd
30485 ? 00:00:00 mysqld_safe
30549 ? 1-15:07:28 mysqld
32158 ? 00:06:29 httpd
32166 ? 00:12:39 pure-ftpd
32168 ? 00:07:12 pure-authd
32181 ? 00:01:06 crond
32368 ? 00:00:00 saslauthd
32373 ? 00:00:00 saslauthd
PS is an extremely powerful and versatile command, and you can learn more by ‘ps --h’:
root@gateway [~]# ps --h
********* simple selection ********* ********* selection by list *********
-A all processes -C by command name
-N negate selection -G by real group ID (supports names)
-a all w/ tty except session leaders -U by real user ID (supports names)
-d all except session leaders -g by session OR by effective group name
-e all processes -p by process ID
T all processes on this terminal -s processes in the sessions given
a all w/ tty, including other users -t by tty
g OBSOLETE -- DO NOT USE -u by effective user ID (supports names)
r only running processes U processes for specified users
x processes w/o controlling ttys t by tty
*********** output format ********** *********** long options ***********
-o,o user-defined -f full --Group --User --pid --cols --ppid
-j,j job control s signal --group --user --sid --rows --info
-O,O preloaded -o v virtual memory --cumulative --format --deselect
-l,l long u user-oriented --sort --tty --forest --version
-F extra full X registers --heading --no-heading --context
********* misc options *********
-V,V show version L list format codes f ASCII art forest
-m,m,-L,-T,H threads S children in sum -y change -l format
-M,Z security data c true command name -c scheduling class
-w,w wide output n numeric WCHAN,UID -H process hierarchy


Decrypt Cisco Type-7 Passwords on the fly!


