Measuring Network Performance: Test Network Throughput, Delay-Latency, Jitter, Transfer Speeds, Packet loss & Reliability. Packet Generation Using Iperf / Jperf

network-performance-testing-1aMeasuring network performance has always been a difficult and unclear task, mainly because most engineers and administrators are unsure which approach is best suited for their LAN or WAN network.

A common (and very simple) method of testing network performance is by initiating a simple file transfer from one end (usually workstation) to another (usually server), however, this method is frequently debated amongst engineers and there is good reason for that: When performing file transfers, we are not only measuring the transfer speed but also hard disk delays on both ends of the stream. It is very likely that the destination target is capable of accepting greater transmission rates than the source is able to send, or the other way around. These bottlenecks, caused by hard disk drives, operating system queuing mechanism or other hardware components, introduce unwanted delays, ultimately providing incorrect results.

The best way to measure the maximum throughput and other aspects of a network is to minimise the delay introduced by the machines participating in the test. High/Mid-end machines (servers, workstations or laptops) can be used to perform these tests, as long as they are not dealing with other tasks during the test operations.

While large companies have the financial resources to overcome all the above and purchase expensive equipment dedicated to testing network environments, the rest of us can rely on other methods and tools, most of which are freely available from the open source community.

Related articles:

Introducing Iperf

Iperf is a simple and very powerful network tool that was developed for measuring TCP and UDP bandwidth performance. By tuning various parameters and characteristics of the TCP/UDP protocol, the engineer is able to perform a number of tests that will provide an insight into the network’s bandwidth availability, delay, jitter and data loss.

Main features of Iperf include:

  • TCP and UDP Bandwidth Measurement
  • Reporting of Maximum Segment Size / Maximum Transmission Unit
  • Support for TCP Window size
  • Multi-threaded for multiple simultaneous connections
  • Creation of specific UDP bandwidth streams
  • Measurement of packet loss
  • Measurement of delay jitter
  • Ability to run as a service or daemon
  • Option to set and interval to automate performance tests
  • Save results and errors to a file (useful for reviewing results later)
  • Runs under Windows, Linux OSX or Solaris

Unlike other fancy tools, Iperf is a command line program that accepts a number of different options, making it very easy and flexible to use. Users who prefer GUI based tools can download Kperf or Jperf, which are enhancement projects aimed to provide a friendly GUI interface for Iperf.

zoho-opmanager-800x140

Another great thing about Iperf is that both ends do not require to be on the same type of operating system. This means that one end can be running on a Windows PC/Server while the other end is a Linux based system.

Currently supported operating systems are as follows:

  • Windows 2000, XP, 2003, Vista, 7, 8 & Windows 2008
  • Linux 32bit (i386)
  • Linux 64bit (AMD64)
  • MacOS X (Intel & PowerPC)
  • Oracle Solaris (8, 9 and 10)

Downloading Iperf/Jperf for Windows & Linux - Compiling & Installing on Linux

Iperf is available as a free download from our Administrator Utilities download section. The downloadable zip file contains the Windows and Linux version of Iperf, along with the Java-based graphical interfaces (Jperf). Full installation instructions are available within the .zip file.

The Linux version is easily installed using the procedure outlined below. First step is to untar and unzip the file containing the Iperf application:

[root@Nightsky ~]# tar -zxvf iperf-2.0.5.tar.gz


Next, enter the Iperf directory, configure, compile and install the application:

[root@Nightsky ~]# cd iperf-2.0.5
[root@Nightsky iperf-2.0.5]# ./configure
[root@Nightsky iperf-2.0.5]# make
<output omitted>
[root@Nightsky iperf-2.0.5]#  make install
<output omitted>


Finally, clean the directory containing our compiled leftover files:

 [root@Nightsky iperf-2.0.5]# make clean

Iperf can be conveniently found in the /usr/local/bin/ directory on the Linux server or workstation.

Below is a screenshot from the Windows GUI - Jperf application. Its friendly interface makes it easy to select bandwidth speed, protocol specific parameters, and much more, with just a few clicks. At the top of the GUI, Jperf will also display the CLI command used for the options selected - a neat feature:
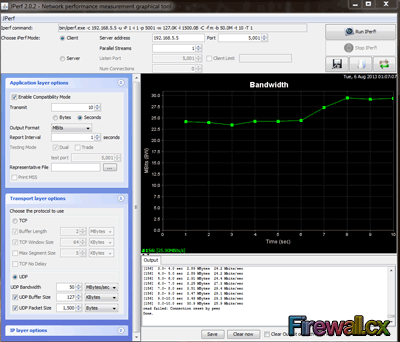
network-performance-testing-5s

Ideas On Unleashing Iperf – Detailed Examples On How To Use Iperf

Having a great tool like Iperf to measure network performance, packet loss, jitter and other characteristics of a network, opens a number of brilliant possibilities that can help an engineer not only identify possible pitfalls in their network (LAN or WAN), but also test different vendor equipment and technologies to discover real performance differences between them.  

Here are a few ideas the Firewall.cx team came up with during our brainstorming session on Iperf:

  • Measuring the network (LAN) backbone throughput.
  • Measuring Jitter and packet loss across links. The jitter value is particularly important on network links supporting voice over IP (VoIP) because a high jitter can break a VoIP call.
  • Test WAN link speeds and CIR – Is the Telco provider delivering the speeds we are paying for?
  • Test router or firewall VPN throughput between links. By tuning IPSec encryption algorithms we can increase our throughput significantly.
  • Test Access Point performance between clients. Wireless clients connect at 150Mbps or 300Mbps to an access point, but what are the maximum speeds that can be achieved between them?
  • Test Client – Server bottlenecks. If there’s a server performance issue and we are not quite sure if its network related, Iperf can help shed light on the source of the problem, leaving out of the equation possible bottlenecks such as hard disk drives.
  • Creating parallel data transfer streams to increase load on the network to test router or switch utilisation. By running Iperf on multiple workstations with multiple threads, we can create a significant amount of load on our network and perform various stress-tests.

At first sight, it is evident that Iperf is a tool that can be used to test any part of your network, whether it be Copper (UTP) links, fiber optic links, Wi-Fi, leased lines, VoIP infrastructure and much more.

Because every network has different needs and problems we thought it would be better to take a different approach to Iperf and, instead of presenting test results of our setups (LAB Environment), show how it can be used to test and diagnose different problems engineers are forced to deal with.

By having a firm understanding how to use the options supported by Iperf, engineers can tweak the commands to help them identify their own network problems and test their network performance.

For this reason, we have split this Iperf presentation by covering its various parameters. Note the parameters are case sensitive:

  • Default Iperf Settings for Server and Client
  • Communications Ports (-p), Interval (-i) and timing (-t)
  • Data format report (Kbps, Mbps, Kbytes, Mbytes)  (-f)
  • Buffer lengths to read or write (-l)
  • UDP Protocol Tests (-u) & UDP bandwidth settings (-b)
  • Multiple parallel threads (-P)
  • Bi-directional bandwidth measurement (-r)
  • Simultaneous bi-directional bandwidth measurement (-d)
  • TCP Window size (-w)
  • TCP Maximum Segment Size (MSS) (-M)
  • Iperf Help (-h)

Default Iperf Settings for Server and Client

Server Side

By default, Iperf server listens on TCP port 5001 with a TCP window size of 85Kbytes. When running Iperf in server mode under Windows, the TCP window size is set to 64Kbytes. The Iperf server is run using the following command:

[root@Nightsky bin]# iperf -s
------------------------------------------------------------
Server listening on TCP port 5001
TCP window size: 85.3 KByte (default)
------------------------------------------------------------

Client Side

The Iperf client connects to the Iperf server at TCP port 5001. When running in client mode we must specify the Iperf server’s IP address. Iperf will run immediately and present its results:

C:\Users\Chris\Desktop\iperf-2.0.5-2-win32> iperf -c 192.168.5.5
------------------------------------------------------------
Client connecting to 192.168.5.5, TCP port 5001
TCP window size: 64.0 KByte (default)
------------------------------------------------------------
[  3] local 192.168.5.237 port 52339 connected with 192.168.5.5 port 5001
[ ID] Interval       Transfer     Bandwidth
[  3]  0.0-10.0 sec   105 MBytes  87.6 Mbits/sec
The average bandwidth test was 87.6Mbps

 Server Side Results

The server also provides the test results, allowing both ends to verify the results. In some cases there might be a minor difference in the bandwidth because of how it's calculated from each end:

------------------------------------------------------------
Server listening on TCP port 5001
TCP window size: 85.3 KByte (default)
------------------------------------------------------------
[  4] local 192.168.5.5 port 5001 connected with 192.168.5.237 port 52339
[ ID] Interval       Transfer     Bandwidth
[  4]  0.0-10.0 sec   105 MBytes  87.5 Mbits/sec

Communications Ports (-p), Interval (-i) and Timing (-t)

The port under which Iperf runs can be changed using the –p parameter. The same value must be configured on both server and client side. The interval -i is a Server/Client parameter used to set the interval between periodic bandwidth reports, in seconds, and is very useful to see how bandwidth reports change during the testing period.

The timing parameter –t is client specific and specifies the duration of the test in seconds. The default is 10 seconds.

Server Side

[root@Nightsky bin]# iperf -s -p 32000
------------------------------------------------------------
Server listening on TCP port 32000
TCP window size: 85.3 KByte (default)
------------------------------------------------------------

 Client Side

C:\Users\Chris\Desktop\iperf-2.0.5-2-win32> iperf -c 192.168.5.5 -p 32000 -i 2 -t 5
------------------------------------------------------------
Client connecting to 192.168.5.5, TCP port 32000
TCP window size: 64.0 KByte (default)
------------------------------------------------------------
[  3] local 192.168.5.237 port 52602 connected with 192.168.5.5 port 32000
[ ID] Interval       Transfer     Bandwidth
[  3]  0.0- 2.0 sec  20.4 MBytes  85.5 Mbits/sec
[  3]  2.0- 4.0 sec  20.8 MBytes  87.0 Mbits/sec
[  3]  0.0- 5.0 sec  51.8 MBytes  86.5 Mbits/sec

 Server Side Results

------------------------------------------------------------
Server listening on TCP port 32000
TCP window size: 85.3 KByte (default)
------------------------------------------------------------
[  4] local 192.168.5.5 port 32000 connected with 192.168.5.237 port 52678
[ ID] Interval       Transfer     Bandwidth
[  4]  0.0- 5.0 sec  51.6 MBytes  86.2 Mbits/sec

Data Format Report (Kbytes & Kbps, Mbytes & Mbps)  (-f) – Server/Client Parameter

Iperf can display the bandwidth results in different format, making it easy to read. Bandwidth measurements and data transfers will be displayed in the format selected.

Server side

[root@Nightsky bin]# iperf -s
------------------------------------------------------------
Server listening on TCP port 5001
TCP window size: 85.3 KByte (default)
------------------------------------------------------------

Client Side

Here a test is performed on a 10Mbps link using default parameters. Notice the Transfer and Bandwidth report at the end:

C:\Users\Chris\Desktop\iperf-2.0.5-2-win32> iperf -c 192.168.5.5
------------------------------------------------------------
Client connecting to 192.168.5.5, TCP port 5001
TCP window size: 64.0 KByte (default)
------------------------------------------------------------
[  3] local 192.168.5.237 port 53006 connected with 192.168.5.5 port 5001
[ ID] Interval       Transfer     Bandwidth
[  3]  0.0-10.2 sec  11.4 MBytes  9.39 Mbits/sec

Same test was executed with the –f k parameter so that Iperf would display the results in Kilobytes and Kbps format:

C:\Users\Chris\Desktop\iperf-2.0.5-2-win32> iperf -c 192.168.5.5 -f k
------------------------------------------------------------
Client connecting to 192.168.5.5, TCP port 5001
TCP window size: 64.0 KByte (default)
------------------------------------------------------------
[  3] local 192.168.5.237 port 53038 connected with 192.168.5.5 port 5001
[ ID] Interval       Transfer     Bandwidth
[  3]  0.0-10.2 sec  11648 KBytes  9373 Kbits/sec

Buffer Lengths To Read Or Write (-l) – Server/Client Parameter

The buffer lengths are rarely used, however, they are useful when dealing with large capacity links such as local networks (LAN). The –lparameter specifies the length of buffer read/write for each side and is a client/server parameter. Values specified can be in K (Kbytes) or M (Mbytes). It’s best to always ensure both sides have the same buffer value set. The default length of read/write buffer is 8K.

Server Side

[root@Nightsky bin]# iperf -s -l 256K
------------------------------------------------------------
Server listening on TCP port 5001
TCP window size: 85.3 KByte (default)
------------------------------------------------------------

Client Side with default read/write buffer of 8K.

Note that for test, the Server side was not set, making it the default value of 8K.

C:\Users\Chris\Desktop\iperf-2.0.5-2-win32> iperf -c 192.168.5.241
------------------------------------------------------------
Client connecting to 192.168.5.241, TCP port 5001
TCP window size: 64.0 KByte (default)
------------------------------------------------------------
[  3] local 192.168.5.237 port 53331 connected with 192.168.5.241 port 5001
[ ID] Interval       Transfer     Bandwidth
[  3]  0.0-10.0 sec   735 MBytes   616 Mbits/sec

Client Side with read/write buffer of 256K.

Note that, for this test, the Server side was set to the same buffer length value of 256K.

C:\Users\Chris\Desktop\iperf-2.0.5-2-win32> iperf -c 192.168.5.241 -l 256K
------------------------------------------------------------
Client connecting to 192.168.5.241, TCP port 5001
TCP window size: 64.0 KByte (default)
------------------------------------------------------------
[  3] local 192.168.5.237 port 53330 connected with 192.168.5.241 port 5001
[ ID] Interval       Transfer     Bandwidth
[  3]  0.0-10.0 sec   796 MBytes   667 Mbits/sec

Client Side with read/write buffer of 20MB.

Note that, for this test, the Server side was set to the same buffer length value of 20MB. Notice the dramatic increase of Transfer and Bandwidth with a 20MB read/write buffer:

C:\Users\Chris\Desktop\iperf-2.0.5-2-win32> iperf -c 192.168.5.241 -l 20M
------------------------------------------------------------
Client connecting to 192.168.5.241, TCP port 5001
TCP window size: 64.0 KByte (default)
------------------------------------------------------------
[  3] local 192.168.5.237 port 53860 connected with 192.168.5.241 port 5001
[ ID] Interval       Transfer     Bandwidth
[  3]  0.0-10.2 sec   980 MBytes   803 Mbits/sec

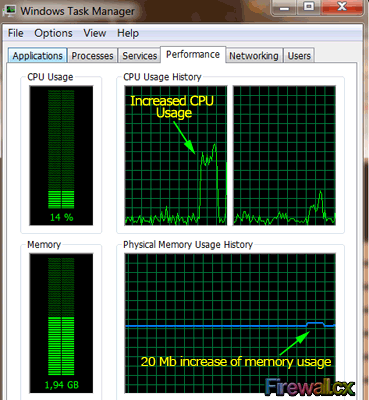
When running tests with large read/write buffers it is equally interesting to monitor the client’s or server’s CPU, memory and bandwidth usage.

Since the 20MB buffer is swapped to memory during the test there will be a noticeable increase of memory usage. Those curious can also try a much larger buffer such as 100MB to see how the system will respond. At the same time, CPU usage will also increase as it is handing the packets being generated and received. Our Dual-Core CPU handled the test without a problem, however, it doesn't take much to bring the system to its knees. For this reason it is highly advisable not run other heavy applications during the tests:
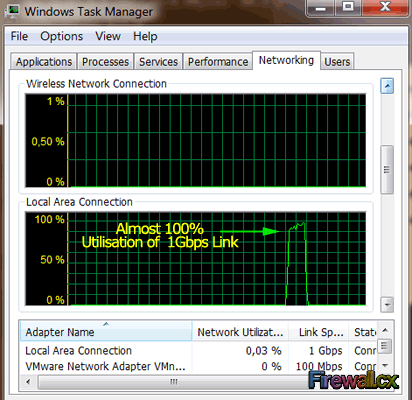
On the other hand, monitoring the network utilisation through the Windows Task Manager also helps provide a visual result of the network throughput test:
network-performance-testing-3

UDP Protocol Tests (-u) & UDP Bandwidth Settings (-b) – Important For VoIP Networks

The –u parameter is a Server/Client specific parameter.

VoIP networks are great candidates for this type of test and extremely important. UDP tests can provide us with valuable information on jitter and packet loss. Jitter is the latency variation and does not depend on the latency itself. We can have high response times and low jitter values without introducing VoIP communications problems. High jitter can cause serious problems to VoIP calls and even break them.

The UDP test also measures the packet loss of your network. A good quality link must have a packet loss less than 1%.

The –b parameter is client specific and allows us to specify the bandwidth to send in bits/sec. The useful combination of –u and –b allows us to control the rate at which data is sent across the link being tested. The default value is 1Mbps.

Server Side

[root@Nightsky bin]# iperf -s -u
------------------------------------------------------------
Server listening on UDP port 5001
Receiving 1470 byte datagrams
UDP buffer size:  224 KByte (default)
------------------------------------------------------------

Client Side

The following command instructs our client to send UDP data at the rate of 10Mbps:

C:\Users\Chris\Desktop\iperf-2.0.5-2-win32> iperf -c 192.168.5.5 -u -b10m
------------------------------------------------------------
Client connecting to 192.168.5.5, UDP port 5001
Sending 1470 byte datagrams
UDP buffer size: 64.0 KByte (default)
------------------------------------------------------------
[  3] local 192.168.5.237 port 64214 connected with 192.168.5.5 port 5001
[ ID] Interval       Transfer     Bandwidth
[  3]  0.0-10.0 sec  11.8 MBytes  9.89 Mbits/sec
[  3] Sent 8418 datagrams
[  3] Server Report:
[  3]  0.0-10.0 sec  5.23 MBytes  4.39 Mbits/sec   0.218 ms 4683/ 8417 (56%)
[  3]  0.0-10.0 sec  1 datagrams received out-of-order

It is important to note that the Iperf client presents its local and remote Iperf server statistics. While the client reports that it was able to send data at the rate of 9.89Mbps, the server reported it was receiving data at the rate of 4.39Mbps, clearly indicating a problem in our link.

Next in the server’s bandwidth report (4.39Mbps) are the jitter and packet lossstatistics. The jitter was measured at 0.218msec – an acceptable delay, however, the 56% packet loss is totally unacceptable and explains why the server received slightly less than half (4.39Mbps) of the transmitted rate of 9.89Mbps.

When tests reveal possible network problems it is always best to re-run the test to determine if packet loss is constant or happens at specific times during the total transfer. This information can be revealed by repeating the Iperf command but including the –i 2 parameter, which instructs our client to send UDP data at the rate of 10Mbps and sets interval between periodic bandwidth reports to 2 seconds:

Client Side

C:\Users\Chris\Desktop\iperf-2.0.5-2-win32> iperf -c 192.168.5.5 -u -b10m -i 2
------------------------------------------------------------
Client connecting to 192.168.5.5, UDP port 5001
Sending 1470 byte datagrams
UDP buffer size: 64.0 KByte (default)
------------------------------------------------------------
[  3] local 192.168.5.237 port 64609 connected with 192.168.5.5 port 5001
[ ID] Interval       Transfer     Bandwidth
[  3]  0.0- 2.0 sec  2.32 MBytes  9.74 Mbits/sec
[  3]  2.0- 4.0 sec  2.40 MBytes  10.1 Mbits/sec
[  3]  4.0- 6.0 sec  2.34 MBytes  9.80 Mbits/sec
[  3]  6.0- 8.0 sec  2.07 MBytes  8.68 Mbits/sec
[  3]  8.0-10.0 sec  2.06 MBytes  8.64 Mbits/sec
[  3]  0.0-10.3 sec  11.2 MBytes  9.10 Mbits/sec
[  3] Sent 7983 datagrams
[  3] Server Report:
[  3]  0.0-50.4 sec  4.76 MBytes   793 Kbits/sec   0.270 ms 4584/ 7982 (57%)
[  3]  0.0-50.4 sec  1 datagrams received out-of-order

The results with 2 second interval reporting show that there was a significant drop in transmission speed a bit later than half way through the test, between 6 and 10 seconds. If this was a leased line or Frame Relay link, it would most likely indicate that we are hitting our CIR(Committed Information Rate) and the service provider is slowing down our transmission rates.

Of course, further testing is needed, but any engineer can appreciate the valuable information provided with this simple test.

Multiple Parallel Threads (-P) - Client Specific Parameter

The multiple parallel thread parameter –P is client specific and allows the client side to run multiple threads at the same time. Obviously, using this parameter would divide the bandwidth to the amount of threads running and it's considered a valuable parameter when testing QoS functionality. We combined it with the –l 4M parameter to increase the read/write buffer to 4MB, increasing the performance on both ends.

Server Side

[root@Nightsky bin]# iperf -s -l 4M
------------------------------------------------------------
Server listening on TCP port 5001
TCP window size: 85.3 KByte (default)
------------------------------------------------------------

Client Side

C:\Users\Chris\Desktop\iperf-2.0.5-2-win32> iperf -c 192.168.5.5 -l 4M -P 3
------------------------------------------------------------
Client connecting to 192.168.5.5, TCP port 5001
TCP window size: 64.0 KByte (default)
------------------------------------------------------------
[  5] local 192.168.5.237 port 54222 connected with 192.168.5.5 port 5001
[  3] local 192.168.5.237 port 54220 connected with 192.168.5.5 port 5001
[  4] local 192.168.5.237 port 54221 connected with 192.168.5.5 port 5001
[ ID] Interval       Transfer     Bandwidth
[  5]  0.0-11.5 sec  44.0 MBytes  32.1 Mbits/sec
[  4]  0.0-11.7 sec  44.0 MBytes  31.5 Mbits/sec
[  3]  0.0-11.8 sec  44.0 MBytes  31.4 Mbits/sec
[SUM]  0.0-11.8 sec   132 MBytes  94.1 Mbits/sec

Individual Bi-directional Bandwidth Measurement (-r) - Client Specific Parameter

The bi-directional parameter –r forces an individual bi-directional test, forcing the client to become the server after its initial test is complete. This option is considered very useful when it is necessary to test the performance in both directions and saves us manually switching the roles between the client and server.

Server Side

[root@Nightsky bin]# iperf -s
------------------------------------------------------------
Server listening on TCP port 5001
TCP window size: 85.3 KByte (default)
------------------------------------------------------------

Client Side

C:\Users\Chris\Desktop\iperf-2.0.5-2-win32> iperf -c 192.168.5.5 -r
------------------------------------------------------------
Server listening on TCP port 5001
TCP window size: 64.0 KByte (default)
------------------------------------------------------------
------------------------------------------------------------
Client connecting to 192.168.5.5, TCP port 5001
TCP window size: 64.0 KByte (default)
------------------------------------------------------------
[  4] local 192.168.5.237 port 54538 connected with 192.168.5.5 port 5001
[ ID] Interval       Transfer     Bandwidth
[  4]  0.0-10.0 sec   103 MBytes  86.3 Mbits/sec
[  4] local 192.168.5.237 port 5001 connected with 192.168.5.5 port 39426
[  4]  0.0-10.0 sec   110 MBytes  92.5 Mbits/sec

Notice the two connections created, one for each direction. A similar report is generated on the server’s side.

Simultaneous Bi-directional Bandwidth Measurement (-d) – Client Specific

The simultaneous bi-directional bandwidth measurement parameter –d is client specific and forces a simultaneous two way data transfer test. Think about is as a full-duplex test between the server and client. This test is great for leased line WAN links which offer synchronous download/upload speeds.

We tested it between our Linux server and Windows 7 client using the –l 5M parameter, to increase the send/receive buffer and test out speeds through a 100Mbit link.

Server Side

[root@Nightsky bin]# iperf -s -l 5M
------------------------------------------------------------
Server listening on TCP port 5001
TCP window size: 85.3 KByte (default)
------------------------------------------------------------

 Client Side

C:\Users\Chris\Desktop\iperf-2.0.5-2-win32> iperf -c 192.168.5.5 -d -l 5M
------------------------------------------------------------
Server listening on TCP port 5001
TCP window size: 64.0 KByte (default)
------------------------------------------------------------
------------------------------------------------------------
Client connecting to 192.168.5.5, TCP port 5001
TCP window size: 64.0 KByte (default)
------------------------------------------------------------
[  4] local 192.168.5.237 port 52671 connected with 192.168.5.5 port 5001
[  5] local 192.168.5.237 port 5001 connected with 192.168.5.5 port 39430
[ ID] Interval       Transfer     Bandwidth
[  5]  0.0-10.3 sec  90.0 MBytes  73.2 Mbits/sec
[  4]  0.0-10.7 sec   115 MBytes  90.0 Mbits/sec

We can see the two sessions [4 & 5] created between our two endpoints along with their results – an average of 81,6Mbps ( (73.2+90) / 2), falling slightly short of our expectations of our 100Mbpstest link.

TCP Window Size (-w) – Server/Client Parameter

The TCP Window size can be set using the –w parameter. The TCP Window size represents the amount of data that can be sent from the server without the receiver being required to acknowledge it. Typical values are between 2 and 65,535bytes. The default value is 64KB.

Firewall.cx has covered the TCP Window size concept in great depth. Readers can refer to our TCP Windows Size article to understand its importance and how it can help increase throughput on links with increased latency e.g Satellite links.

Server Side

On Linux, when specifying a TCP Window size, the kernel allocated double that requested. Ironically, the Windows operating system allowed a 1MB and even 5MB window size without any problem.

[root@Nightsky bin]# iperf -s -l 5M -w 4000
------------------------------------------------------------
Server listening on TCP port 5001
TCP window size: 7.81 KByte (WARNING: requested 3.91 KByte)
------------------------------------------------------------

 Client Side

C:\Users\Chris\Desktop\iperf-2.0.5-2-win32> iperf -c 192.168.5.5 -l 5M -w 4000
------------------------------------------------------------
Client connecting to 192.168.5.5, TCP port 5001
TCP window size: 3.91 KByte
------------------------------------------------------------
[  3] local 192.168.5.237 port 54172 connected with 192.168.5.5 port 5001
[ ID] Interval       Transfer     Bandwidth
[  3]  0.0-11.5 sec  55.0 MBytes  40.1 Mbits/sec

Using a 4KB TCP Window size gave us only 40.1Mbps - half of our potential 100Mbps link. When we increased this to 64KB, we managed to squeeze out 93.9Mbps throughput!

TCP Maximum Segment Size (MSS) (-M) - Server/Client Parameter

The Maximum Segment Size (mss) is the largest amount of data, in bytes, that a computer can support in a single unfragmented TCP segment. Readers interested in understanding the importance of mss and how it works can refer to our TCP header analysis article.

If the MSS is set too low or high it can greatly affect network performance, especially over WAN links.

Below are some default values for various networks:

Ethernet – Lan: 1500 Bytes
PPPoE ADSL: 1492 Bytes
Dialup: 576 Bytes

Server Side

[root@Nightsky bin]# iperf -s
------------------------------------------------------------
Server listening on TCP port 5001
TCP window size: 85.3 KByte (default)
------------------------------------------------------------

Client Side

C:\Users\Chris\Desktop\iperf-2.0.5-2-win32> iperf -c 192.168.5.5 -M 1350
WARNING: attempt to set TCP maximum segment size to 1350, but got 1281
------------------------------------------------------------
Client connecting to 192.168.5.5, TCP port 5001
TCP window size: 64.0 KByte (default)
------------------------------------------------------------
[  3] local 192.168.5.237 port 54877 connected with 192.168.5.5 port 5001
[ ID] Interval       Transfer     Bandwidth
[  3]  0.0-10.0 sec   105 MBytes  88.2 Mbits/sec

Iperf Help –(h)

While we’ve covered most of the Iperf supported parameters, there are still more readers can discover and work with. Using the iperf –h command will reveal all available options:

C:\Users\Chris\Desktop\iperf-2.0.5-2-win32> iperf -h
Usage: iperf [-s|-c host] [options]
       iperf [-h|--help] [-v|--version]
Client/Server:
  -f, --format    [kmKM]   format to report: Kbits, Mbits, KBytes, MBytes
  -i, --interval  #        seconds between periodic bandwidth reports
  -l, --len       #[KM]    length of buffer to read or write (default 8 KB)
  -m, --print_mss          print TCP maximum segment size (MTU - TCP/IP header)
  -o, --output   output the report or error message to this specified file
  -p, --port      #        server port to listen on/connect to
  -u, --udp                use UDP rather than TCP
  -w, --window    #[KM]    TCP window size (socket buffer size)
  -B, --bind        bind to, an interface or multicast address
  -C, --compatibility      for use with older versions does not sent extra msgs
  -M, --mss       #        set TCP maximum segment size (MTU - 40 bytes)
  -N, --nodelay            set TCP no delay, disabling Nagle's Algorithm
  -V, --IPv6Version        Set the domain to IPv6
Server specific:
  -s, --server             run in server mode
  -U, --single_udp         run in single threaded UDP mode
  -D, --daemon             run the server as a daemon
Client specific:
  -b, --bandwidth #[KM]    for UDP, bandwidth to send at in bits/sec
                           (default 1 Mbit/sec, implies -u)
  -c, --client      run in client mode, connecting to
  -d, --dualtest           Do a bidirectional test simultaneously
  -n, --num       #[KM]    number of bytes to transmit (instead of -t)
  -r, --tradeoff           Do a bidirectional test individually
  -t, --time      #        time in seconds to transmit for (default 10 secs)
  -F, --fileinput   input the data to be transmitted from a file
  -I, --stdin              input the data to be transmitted from stdin
  -L, --listenport #       port to receive bidirectional tests back on
  -P, --parallel  #        number of parallel client threads to run
  -T, --ttl       #        time-to-live, for multicast (default 1)
  -Z, --linux-congestion  set TCP congestion control algorithm (Linux only)

 In this article we showed how IT Administrators, IT Managers and Network Engineers can use IPerf to correctly test their network throughput, network delay, packet loss and link reliability.

Netflow vs SNMP. Two Different Approaches to Network Monitoring

netflow vs snmp introductionSNMP (Simple Network Management Protocol) and Netflow are both popular protocols with admins, prized for their ability to give visibility over the network and in some cases discern the cause of network performance issues, network bottlenecks, system resource allocation issues and more. On the Netflow side of things, third-party software vendors like ManageEngine can greatly enhance the usability and capability of the protocol, while SNMP network monitoring applications like PRTG, Solarwinds or alternatively open-source Observium, Nagios and LibreNMS take the lead in delivering a comprehensive in-depth network and system monitoring solution.
Unfortunately, however, the close relationship between the two protocols, especially when it comes to software offerings, has birthed some misconceptions. While it’s common to see SNMP and Netflow as more or less interchangeable, there are some significant and key differences between the two that make them suited for very different use cases.

Key Topics:

 Related Articles:

Understanding SNMP and How it Works

The Simple Network Management Protocol (SNMP) surfaced as early as 1988, with its roots in its predecessor, the Simple Gateway Monitoring Protocol, which was defined in 1987. SNMP was born out of pure necessity – before its existence, network admins didn’t have much visibility over their infrastructure at all. After the crash of the ARPAnet, on the 27th of October 1980, and as the number of complex components in networks began to snowball, it was clear a solution was needed.

However, though SNMP was initially built by a group on university researchers as a temporary solution, it quickly evolved, has remained very relevant even today. It’s not considered part of the application layer of the Internet Protocol Suite and OSI model and exists across three major versions (through SNMPv1 still tends to be the most commonly used).

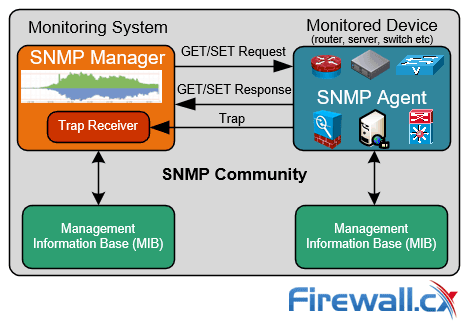
Though SNMP’s name suggests management, it’s more commonly used for the monitoring of different types of network equipment, both on a network and hardware level. Typically, a monitoring server (e.g Nagios, Observium) known as a SNMP Manager monitors devices on the network, with each system holding a software snmp agent that reports information back to the manager:

 how snmp works - snmp components

Illustrating how SNMP works

The SNMP protocol’s job is to send Protocol Data Units (PDUs) messages to other devices in the network, requesting information via an SNMP Get-Request. The sum of the Get-Responses it receives lets network admins track network events via the data it receives. The speed of this process lets admins keep an eye on a network in almost real-time, which is in many cases invaluable. While the SNMP query interval is customizable in every SNMP monitoring application, it is typically configured to poll the monitored device every 5 minutes.

SNMP operates on port 161 and uses UDP as its transport protocol.

Understanding Netflow and How It Works

Though we have covered Netflow extensively in our Complete Guide to Netflow, it’s worth quickly brushing over it. The Cisco Netflow protocol is newer than SMNP, beginning its evolution in 1996 with Cisco’s IOS v11.x. Though it was initially designed a software technique, the company soon implemented hardware-based Cisco Netflow solutions in its switches and expanded it to other hardware.

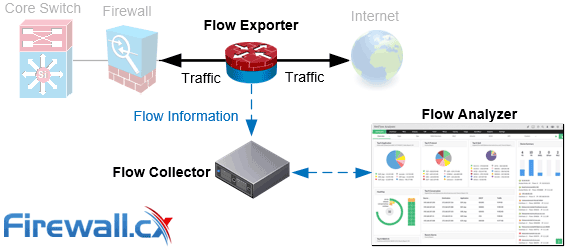
Netflow consists of three components:

  • Netflow Exporter: Typically, a router or firewall that gathers packets into flows and exports flow records to collectors when it decides the flow of information has exported.
  • Netflow Collector:A server that receives the aggregated flows and stores and pre-processes them for use by the Netflow Analyzer.
  • Netflow Analyzer:A software-based solution that provides necessary insights into the data collected, such as ManageEngine.

 how netflow works

Netflow's components: Flow Exporter, Flow Collector and Flow Analyzer

As you can see, the two protocols (Netflow – SNMP) differ significantly in their technique and makeup, there are some areas they cross over and others where they’re significantly different.

Netflow records are exported by the Flow Exporter using the UDPtransport protocol. Common ports used are 2055, 9555, 9995, 9025, 9026 and are usually configurable.  

Netflow vs SNMP: Similarities and Differences, using Real Examples

As both Netflow and SNMP provide network monitoring, there’s some crossover with the information they provide. Both can give a quick overview of the bandwidth usage and utilization to the end-user, and these days both protocols are supported by all major vendors, though SNMPs age still means it has an advantage in that regard.

However, it’s past that the SNMP protocol and Netflow begin to diverge. As mentioned earlier, SNMP provides a real-time overview of the network, but Netflow is a little more limited. Though it tends to provide more verbose information, it isn’t live, instead returning data in predetermined intervals that tend to cap out at a couple of minutes at the shorter end. Additionally, SNMP operates in both push and pull modes, while Netflow is primarily a push technology.

Netflow, however, is more compact and delivers more information in many areas when compared to the SNMP protocol, which is in many ways quite crude. Unlike SNMP, Netflow can filter traffic and differentiate bandwidth usage by protocol or IP. The enablement of filtering and differentiation by protocol and application gives a complete overview of link to application utilization, while SNMP is limited to the interface level.

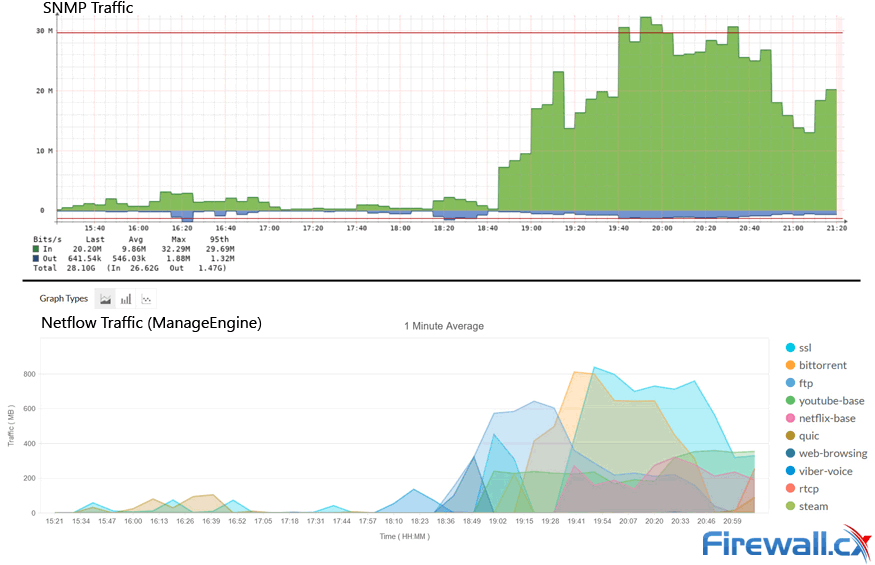
The example below shows how SNMP (top graph) and Netflow (bottom graph) report traffic passing through a monitored interface on a network device (firewall).  While both protocols are capable of showing the overall traffic passing through the interface, Netflow provides a per-application break-down of traffic:

snmp vs netflow network traffic analysis

Comparing SNMP and Netflow network traffic reports from the same source

When monitoring WAN links within an organisation, it is critical to have the ability to properly analyze traffic. SNMP graphs are simply not enough. In the above example, ManageEngine’s Netflow shows the bittorrent application responsible for a large portion of the bandwidth used.

An unexpected spike in traffic can signal problems, a security issue or even a breach in the company’s IT policies. This example highlights an important difference between SNMP and Netflow when used to monitor traffic.

The knock-on effect of this is that Netflow tends to be more difficult to setup. Most of the time, getting netflow configured can be somewhat tricky depending on the device and netflow version supported. Its verbosity also means it can be more intensive and require more bandwidth than SNMP depending on the amount of traffic passing through the monitored links, however with today’s high-bandwidth links this shouldn’t be of any real concern.

Despite this, there is an area where SNMP provides information where Netflow doesn’t – hardware. SNMP is capable of monitoring CPU, memory, disk space, temperature for devices, and more, something Netflow has only been able to do so far in proof of concepts.

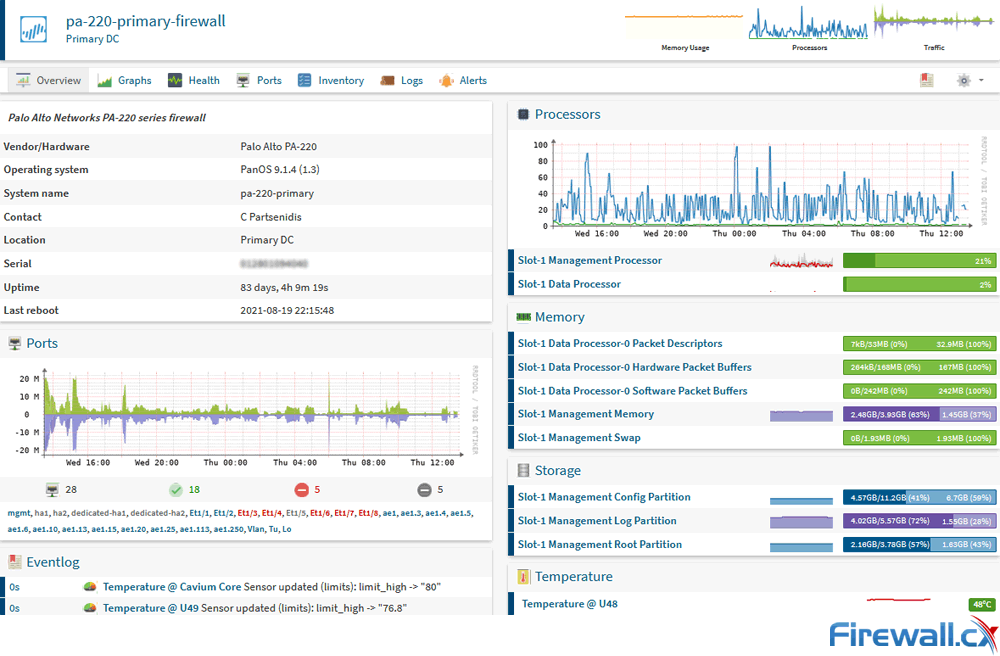
The below screenshot is an example of an SNMP-monitored Palo Alto Next-Gen Firewall:

Palo firewall overview monitoring via snmp

Monitoring a Palo Alto Next-Gen Firewall via SNMP

Our SNMP monitoring server is configured to poll the firewall every 5 minutes and pull a significant amount of information that includes internal bandwidth usage, CPU, memory and storage usage, temperature, event logs and more.

Netflow vs SNMP: Advantages and Disadvantages, using Real Examples

It should be evident that each protocol has different use cases but they also complement each other. When it comes to analyzing traffic information, Netflow is clearly the winner, and it also scales better on the high-traffic networks that professionals are more likely to see.

Netflow’s ability to differentiate and filter by protocol or application means network security professionals can determine which end system is using excessive bandwidth but also assist identifying possible security threats.

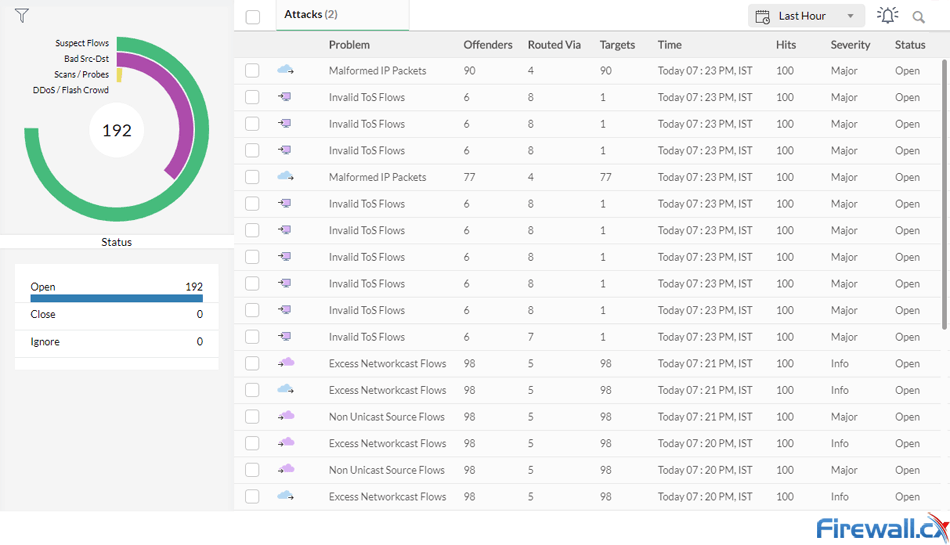
The below screenshot, taken from ManageEngine’s Netflow Analyzer, is a great example on how Netflow can assist in identifying abnormal  traffic patterns, including malformed packets, excessive flows and more:

netflow manageengine security threats
ManageEngine's Netflow security threats interface

In practice, this means you can utilize Netflow to monitor specific aspects like voice and video quality across a network, something just not possible with SNMP. This includes link latency, jitter, call path availability and other important metrics.

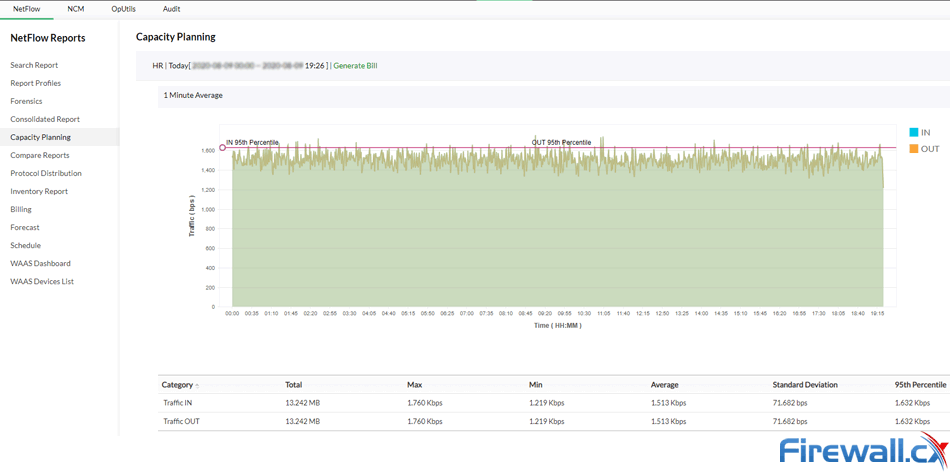
The verbose data also better lends its hand to reporting, which can then be used for network planning or other considerations. For example, you can quickly produce capacity planning reports, get an accurate overview of trends over a long period, and measure bandwidth growth over time. It can also recognise even non-standard applications or those who use dynamic port numbers.

netflow manageengine capacity planningCapacity planning with ManageEngine

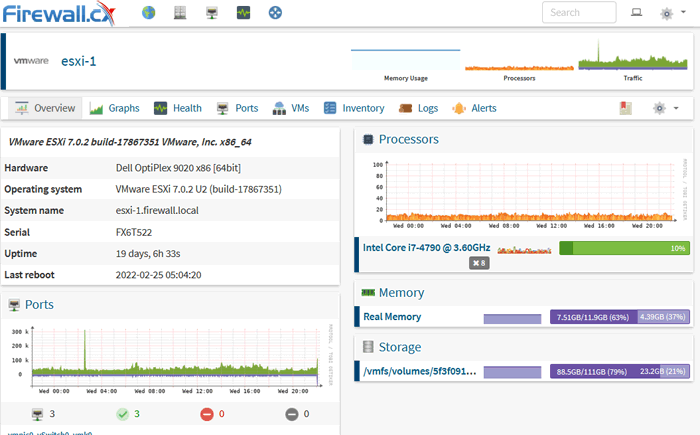
The SNMP protocol’s main advantage is that it is supported widely by almost every type of device that connects to the network and is capable of delivering strong, basic traffic visibility with very low overhead. It can provide efficient quantitative information, including bandwidth, but also detailed system resource usage:  

                                                     esxi server resource monitoringSNMP monitoring of an ESXi host (click to enlarge) 

In the above example, our SNMP monitored host is a lab ESXi server with its SNMP service enabled. The amount of information obtained by SNMP is impressive and detailed: Server information, model number, operating system, port utilization, memory and storage usage, CPU usage and more, are tracked and updated every 5 minutes.

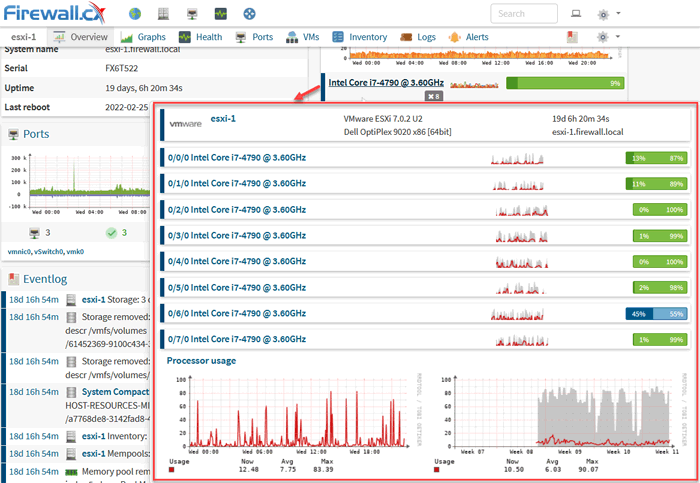
Drilling into further detail, e.g CPU usage, is simple as hovering on-top of the CPU, allowing a pop-up embedded window appear, revealing each core usage over time:

esxi server resource cpu monitoringSNMP monitoring of an ESXi's host CPU (click to enlarge) 

Combining this information with automated alerts, makes SNMP monitoring a powerful tool that cannot however be replaced by Netflow.

Conclusion

The SNMP and Netflow protocol are both standards for a reason. They both have their advantages and disadvantages, and generally both can be used simultaneously to monitor different aspects of a network and its critical devices. Netflow’s aid in network planning and traffic analysis makes it, in many cases, the more helpful tool to network administrators. On the other hand, SNMP’s capabilities to provide overall traffic graphs and detailed resource usage, make it a favourite for system administrators.

Third-party advanced tools like ManageEngine combine the best of both SNMP and Netflow by monitoring every aspect of the network in a simple yet information packed-UI and enabling monitoring of traffic shaping technologies, security alerts, SLAs and more.

Though those interested in networking and system administration should naturally try both SNMP and Netflow tools for themselves, no regrets will be found after taking the time to utilize Netflow and its more diverse functionality.